How to send AWS Cloudwatch Alarm Notifications to a Microsoft Teams Channel: Build and Deploy to EKS using Harness
Microsoft Teams is increasing in popularity across many teams nowadays. It has become a primary means of intra team communication for many technology teams. So it becomes useful if operational teams use Microsoft Teams as an alerting mechanism too. It will be useful if these dev or ops teams, who spend a good amount of time on Teams application, also get alerted about any deployed application events, on the same platform.
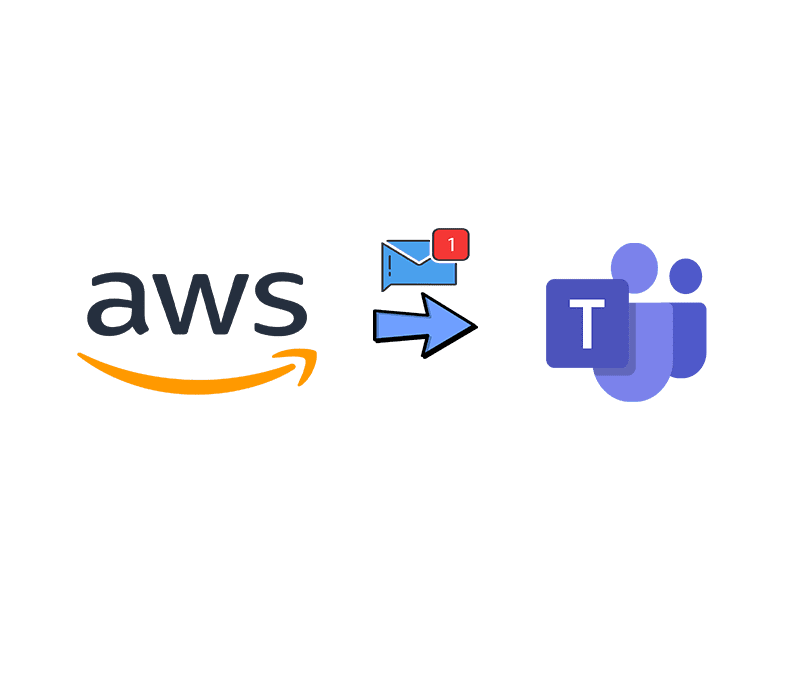
In this post I will be describing one of the ways to get application level alerts on a Microsoft Teams channel. As AWS is the most popular cloud platform now, I am taking example of sending AWS Cloudwatch alerts as messages to a Teams channel instead of an email.
The GitHub repo for this post can be found Here
Pre Requisites
Before I start the walkthrough, there are some some pre-requisites which are good to have if you want to follow along or want to implement this on your own:
- Basic Kubernetes, Terraform and AWS knowledge
- Github account and able to setup Github actions
- Setup a free account on Harness. Free for developer with som limits. For enterprise level use, details can be found Here
- An AWS account. The EKS cluster may incur some charges so make sure to monitor that
- Terraform installed
- Basic Python knowledge
With that out of the way, lets dive into the solution.
Functional Details
Lets first understand how the process works and how the alert gets sent to the Teams channel. Below image shows the whole process of how the alert gets sent from a Test Lambda service to the Teams channel.

- AWS Services sending logs: Different services on AWS are configured to send out logs to Cloudwatch. So in this step, applications deployed on the services, send out logs to Cloudwatch to consolidate the logs in a single location. Different services can be configured to send logs to different Cloudwatch streams. So in this scenario, all the logs from a sample Lambda gets sent to the Cloudwatch stream. In those logs, there are error messages which simulate an error scenario.

- Cloudwatch alarm from logs: Based on some error keywords or patterns from the log data in Cloudwatch, alarms get fired. Different Cloudwatch alarms can be configured to detect different error patterns. Based on the occurrence of the error pattern in the log, if the pattern matches to the alarm config, the alarm moves to alarmed state. In this scenario whenever there are error keyword in the Lambda logs more than once, the Cloudwatch alarm moves to alarmed state.
- Notification to SNS: Once the Cloudwatch alarm moves to alarm state, it sends out a notification. The target of the notification is an SNS topic. Now the SNS topic can forward the notification to many different kind of targets like send an email notification. Here the SNS notification is configured to trigger an API via a Lambda. So whenever the Cloudwatch alarm moves to alarm state, it sends a notification to the SNS topic which calls the Microsoft Teams API via a Lambda
- Microsoft Teams API called: Whenever the SNS topic is invoked and it calls the Teams API, it sends some payload details about the Cloudwatch log which gets sent as the body of the message. The Teams API is responsible for getting the input payload and sending it as a chat message on the specific Teams channel
- Error Metrics: As a separate path, some error metrics also get published based on the SNS calls which pass through the API. These error metrics help measuring some KPIs around the errors happening in the specific application. I am using some basic metrics in my example, but this can definitely be expanded to have more robust metric details sent out to the metric endpoint.

That should cover a high level walkthrough of the process which is followed by this solution.
Tech Architecture and Details
Now that we have an understanding how it works functionally, lets understand how each of those components are built and connected. Below image shows the overall components of the whole solution.

Lets go through each of these in detail.
Test Service and Cloudwatch Alarm
To test the solution for this blog post, I have created a sample Lambda which logs an error in its logs. This error gets logged in the Cloudwatch logs. A separate log stream gets created for this sample Lambda which starts logging these errors whenever the lambda is ran for testing.

Based on the log content and error keyword, a Cloudwatch metric filter is created and an alarm is created base on the metric filter. The alarm triggers whenever there are ‘error’ keyword found in the log for more than once


SNS Topic and Lambda Target
When the cloudwatch alarm moves to alarm state due to errors in the log, it is configured to trigger a notification to a SNS topic. The SNS topic triggers a Lambda as a target so that the APi can be invoked for the Teams API. The SNS topic is configured with the Lambda as a target subscription.

The Lambda itself is developed in Python. It calls the API endpoint for the Microsoft Teams alert API(described below). The API endpoints are passed as environment variables to the Lambda. This gets triggered by the SNS topic and passes the payload from SNS. I wont go through the whole logic of the code. It can be found in the repo (named alarmlambda).

Teams Alert Wrapper API
This is a custom API developed using Python and FastAPI framework. This behaves as a wrapper around the API endpoint provided by Microsoft Teams. This APi takes the input payload from the above Lambda and based on some logic calls the Teams API endpoint, to send a message on the Teams channel. Following flow should explain what the API does:

The API exposes two endpoints:
- /sendalert: This is the endpoint which gets invoked by the Lambda to send over the message to Teams API. The flow for this endpoint is explained above
- /queryalertprom: This endpoint is used by Prometheus to scrape the error metrics. When invoked, this queries the DynamoDB to get the error counts over time and sends as a text response for Prometheus to consume. This error metric can be viewed on Prometheus.

The API is deployed on EKS cluster as a Kubernetes deployment. The endpoint for the API gets exposed via a Load balancer service. The API is built into a Docker image and pushed to a private Gitlab repository from which the EKS cluster pulls the image to deploy.
The load balancer endpoint for the API is exposed via an API Gateway REST API. The API gateway provides security for the API via API keys. Any calls to the API has to provide the respective API key for successful API call. The API key is generated on the API Gateway and associated with the REST API.


Prometheus and Grafana Deployment
The errors which pass through the API, also get logged to a DynamoDB. To have a metric measure of the error numbers or rates, a Prometheus and Grafana stack is deployed. The Prometheus scrapes the API endpoint to get the error number. This metric can be visualized on Grafana using various visualizations. I have just used this as an example but this can be very well extended to log other metrics to have a proper measure around error counts. The Prometheus and Grafana stack is deployed using Helm for ease of deployment. The endpoints for these two can be found from the Load balancers which gets deployed from the services on the EKS cluster


Harness Delegate Deployment
For Harness to be able to connect to the EKS cluster and perform the deployments, a Harness Delegate pod is deployed to the EKS cluster. This Pod acts as an interface between Harness CI/CD and the cluster.
Teams API
This component is not really deployed as part of the application. This the Microsoft Teams API which is provided out of the box by Microsoft. The API endpoints can be generated from the Teams application. I will cover the process for that below.
Github Actions and Harness
The deployment of all of the above components are automated using Github actions and Harness. These two are used for two separate purposes for this application:
- Github Actions: This is used to deploy the infrastructure needed for all of the components. All of the infrastructure get deployed by Github actions, using Terraform
- Harness: This is used for the CI and CD of the application deployment. Harness is used to build the Docker image of the application and deploy to the EKS cluster
Now lets move on to deploying this application.
Deployment
The deployment of the whole solution can be divided into two parts:
- Infrastructure Deployment
- Application Deployment
I will cover each of these separately. But first lets see the infrastructure view of what we will be deploying to AWS

I have already covered about each of these components and what each do. So lets dive into process of deploying these. First we will go through the process of deploying the infrastructure.
Folder Structure
First let me explain the folder structure for my repo if you want to use my repo.

- .github: This folder contains the Github actions workflow files
- alarmlambda: This folder contains the files for the Lambda which will be triggered by SNS to send the message payload
- infra_yamls: This folder contains various Yaml files to deploy the Prometheus stack and the Harness delegate pod, to the EKS cluster
- teamsalertapi: This folder contains the code and the deployment files for the custom Fast API which will be deployed to the EKS cluster.
- terraform_modules: This folder contains all of the Terraform modules to deploy different infrastructure components of the whole solution
- grafana_dashboard.json: This is just a sample dashboard export from the Grafana instance I deployed. This can be imported and used in any grafana instance.
Infrastructure Deployment
For the infrastructure deployment, I am using Github actions. The Github actions workflow has been added as part of the repo. The infrastructure deployment flow can be shown as below:

Create S3 Bucket
In this stage S3 bucket gets created, which will be used to store the Terraform state. AWS credentials also get configured as part of this stage, to be used to create the bucket.


Deploy Infrastructure using Terraform
In this stage, Terraform gets installed on the runner and after configuring AWS credentials, the Terraform modules get applied. All of the Terraform modules get deployed as part of this stage.


Deploy Harness Delegate
The Harness needs to be deployed to the EKS cluster. The yaml file for the deployment is part of the repo. In this stage, kubectl is used to run the command to apply the yaml file and perform the deployment to EKS cluster. To be able to run kubectl command, it also gets installed on the runner in this step.


Deploy Prometheus and Grafana Stack
In this stage helm is used to deploy the Prometheus and Grafana stack to the EKS cluster. Custom values are passed to the deployment via a value.yml file which is part of the repo folder. First Helm gets installed on the runner and after configuring AWS credentials, it runs the helm command to install the stack. It also deploys the service to expose the Grafana and Prometheus endpoints via Load balancer services.


For setting up the Github actions itself, there are no separate steps as such, but high level this can be followed:
- Create the workflows.yml file and place it in the workflows folder inside the .github folder of the repo. Once this is pushed to the Github, the actions flow starts running

- For the AWS credentials, secrets an be added to the Github repo, which will get referred in the flow. Click on Settings on the Github repo (you need admin access on the repo). Then click on Secrets->Actions on the left navigation bar. On the page add secrets as needed and refer them in the flow.

- Once the workflow runs, you can open any stage to check the details or logs for the specific stage. This helps troubleshooting when any error happens in the workflow


Once the workflow completes running, we should have a running EKS cluster on AWS. Login to AWS to check the cluster

Application Deployment
Now that we have the infrastructure, we can move to deploying the application. The application is basically the API wrapper which will be calling the Teams API. The API is developed using Fast API framework and will be deployed as a deployment to the EKS cluster. But before we can deploy, we will need to have a registry which will hold the Docker images for the API. Iam using a free container registry provided by Gitlab. It is a private registry which comes as part of Gitlab projects. You can use your own private registry to store the images. if you want to use Gitlab, follow these steps to create a container registry:
- Register for an account at Gitlab
- Create a new project in Gitlab
- Navigate to the project and open the container registry page. Create a new registry and follow the login steps which are shown on screen

Use the personal token from Gitlab to generate a dockerconfig which will be created as a secret and use for image pull secret by the deployment. For more details on how to create this secret, follow this
The application deployment is split into two flows. One is to build the image and the other is to deploy the api to the cluster. Below image will show this flow

Both of the above flows are defined as separate pipelines in harness.

App Build Flow
In this pipeline the application gets build to a Docker image. The Harness CI Pipeline builds the Docker image by checking out the code from repo and then pushes the built image to the Gitlab private repository with specific tag.

The Dockerfile is defined in the code folder based on which the image gets built.


App Deploy Flow
This pipeline handles the deployment of the API to the EKS cluster. The Docker image which was pushed to the Gitlab repo in the CI pipeline, is pulled by the EKS cluster during deployment. The YAML file for the deployment is defined in the folder. The pipeline is a CD pipeline defined on Harness which deploys to the EKS cluster by connecting via the Harness delegate. The app deploy flow image shows how Harness is connecting to the EKS cluster for deployment.
- A Delegate is created on Harness which provides a Yaml file for a statefulset to be deployed on the cluster, to which Harness has to connect
- The delegate yaml is applied and the Statefulset gets deployed to the cluster. Her I have deployed the Harness delegate as part of the infrastructure deployment pipeline using Github actions
- Whenever the CD pipeline runs, it connects to the Delegate to get the necessary permissions an connections to deploy the application


Teams API endpoint
To be able to connect to Microsoft Teams, we will need the endpoint for Teams API. This endpoint will be passed as environment variable to the API deployed on the EKS cluster. To generate the API endpoint, open the Teams app and navigate to the specific Teams where the channel resides.
- Click on Options for the Team and Click on manage Team. On the page click on Apps tab
- Search for app ‘Incoming Webhook’

- Select the app and select add to team

- Once the app is added, it will provide an URL which needs to be copied and used in the custom API. This URL is passed as environment variable to the API deployment on the EKS cluster


Setup Harness for Build and Deploy
An important part of deploying this API is setting up Harness so it can be used to perform the build and deploy to the EKS cluster. There are lot of documentation available around usage of Harness and can be found here, so I am going through some of the steps at very high level for you to understand the minimal setup to get Harness up and running. To use harness, I will suggest to get a free account first at the Harness website here. Lets go through the steps to setup the pipelines on Harness.
After logging in to Harness, first step will be to create a new Project. A new project is created to host al pipelines needed

After creating the project, navigate to the project for next steps.
New Delegate Setup
Navigate to the Delegates tab from the Project setup menu on left. A new delegate needs to be created. Click on the New button to start creating a new one. Follow on screen options to match your requirements. I have selected Delegate to run on Kubernetes cluster. Once all options are selected, it will provide you with he Yaml file to be deployed to the Kubernetes cluster.

This Yaml need to applied to the Kubernetes cluster where the deployments will be happening. I have taken this yaml and deploy this delegate to the cluster via Github actions. Once the delegate is successfully deployed to the Kubernetes cluster, and it starts sending heartbeats to Harness, there should be a pod running on the cluster in harness-delegate-ng namespace

Also the delegate on Harness console, shows a connected status, confirming successful connection between Harness and the EKS cluster

Connector Setup
Once the delegate is setup, we need to define a connector. This connector is what the Harness pipeline will use to connect to the cluster via the delegate. To setup a new connector, navigate to the Connectors tab on the Project setup menu. Click on new button to start creating a new connector. Since this is connecting to a Kubernetes cluster, lets select the Kubernetes connector

Follow the on screen prompts to select settings as needed. Select the Delegate option for the credentials.

Once done, save the connector. It should show a successful connection to the cluster if the delegate is in healthy state

Now that the delegate and connectors are setup lets move on to building the pipelines. Before starting the pipeline, create a secret to store the Docker registry token. I am storing the Gitlab registry token in the secret. The CI pipeline uses this secret to connect to the Gitlab registry and push the Docker image

CI Pipeline Setup
First we will setup the CI pipeline, which will build the image for the API. To setup the pipeline, first navigate to the Pipelines tab of the sidebar menu.
- Click on New pipeline. On the pop up provide a suitable name and select the inline option. We can also provide the pipeline fil in the repo but for this example I am setting it up inline
- It will now open the pipeline studio. Add a new step and select the type as Build

- In the new stage page, provide the name and the repo connector. This is connector which you connected with Harness. Also provide the repo name from which it will checkout the code

- Next add a new step and select the Build and Push Docker step. This step will build and push the image to the registry

- In the step config page, you will need to define a connector for the pipeline to be able to push the Docker image. Here I have created a connector for Gitlab registry. Create a new connector from the Docker connector field and provide the asked details. Provide the registry url in the same page


- Now apply the changes and save the pipeline. You are ready to run the build. Run the pipeline by clicking on the run button at top. It will ask for a confirmation and start running the pipeline.


- You should see the image built and pushed to the Image registry


Now we have a built image which we can deploy via the CD pipeline.
CD Pipeline Setup
Lets now build the deployment pipeline. To start creating the pipeline, click on the Pipelines tab and click new button
- On the create new page provide a name and select Inline option. Once created, add a new stage and select the Deploy option

-
Next we need to configure the stage to deploy to the cluster. There are few steps to configure here
- Service: Here we define what we are deploying. The deployment yaml for the api is part of the repo in a folder. On the service definition tab, select the Deployment type as Kubernetes and add the details for the manifest file, which is the yaml file for the deployment. For my example the yaml file is in a folder in the source repo.

- Infrastructure: Here we setup where we want to deploy the application. Provide the details for the cluster connection for the pipeline to use and deploy. We already have the connector created before, so we just have to provide a new environment name and select the connector

- Service: Here we define what we are deploying. The deployment yaml for the api is part of the repo in a folder. On the service definition tab, select the Deployment type as Kubernetes and add the details for the manifest file, which is the yaml file for the deployment. For my example the yaml file is in a folder in the source repo.
- Now that we have the infra details defined, lets add the step to perform the deployment. We are performing a rolling deployment here to the EKS cluster. Navigate to the Execution tab and add a new step. Select the Rolling option from the Kubernetes section

For the step parameters, select the delegate which it will be using to connect to the cluster. You already had the delegate created so just select that as the parameter


Once you have these setup, save the pipeline. To run the deployment, run the pipeline and it will start the pipeline performing the deployment. The pipeline will take a while and complete successfully.

To verify the deployment, use kubectl to check the pods. Login to the EKS cluster and run the command to see the pods being deployed.
aws eks update-kubeconfig --name <cluster_name>
kubectl get pods -A

Once the pods successfully run, get the API endpoint from the API gateway which was created. This will be API endpoint to be used to call the API. This endpoint is passed to the Lambda as the environment variable.


Demo and Outputs
Now we have our deployment completed. Lets do some test runs and view the alert messages being sent to the Teams channel. I have created a video showing this in action. The video can be found here . Once the Teams message get sent, the error also gets saved to the Dynamodb table for the metrics


Lets check some metrics around the errors. We already have the Prometheus and Grafana instances deployed to the cluster. Get the URLs from the load balancers which were deployed while deploying the Prometheus and Grafana to open the applications. The Grafana login was defined in the values.yml file and the username is admin. Use that to login. We can check the error metrics on Prometheus


We can use this Prometheus data source on Grafana and create some dashboards around the error metrics


I have included a sample dashboard export in the repo which you can import and use on your own Grafana instance.
Improvements
The example I showed in this post is a very basic implementation of the solution. There is much scope for improving the solution around security and scalability. Some of the ideas which I am working next are:
- https endpoints for Prometheus and Grafana
- Since Cloudwatch logs get delivered with a delay, so introduce a queueing mechanism to delay querying the logs for the error and storing to DynamoDB
- Use Ingress resource on EKS instead of the classic load balancer (which is deprecated)
- Increase security posture by using IAM roles instead of access keys
Conclusion
In this post I explained my solution of sending Cloudwatch alerts to a Microsoft Teams channel, for ease of access by the teams. I think its very useful to be able to alert different teams on specific events happening on an application. Hope this solution can help you structure your alerting mechanism or just help you learn more about deploying to EKS. For any questions or issues please contact me from the contact page.