Stream logs from EC2 to AWS OpenSearch and easily perform searches on the logs: Deploy an OpenSearch cluster on AWS
All applications generate logs. Logs are essential for understanding how software and systems are performing, identifying and troubleshooting issues, and ensuring compliance. Centralizing logs from different sources into a single location can greatly simplify log management, analysis, and monitoring .To be able to efficiently centralize logs , is very useful when debugging applications. There are various ways to efficiently centralize and search on application logs. While trying to learn some of those tools, I started learning AWS Opensearch(previously Elasticsearch service) service. This service really makes it easy to search and analyze the logs collected from different applications.
In this blog post, we will discuss how to stream logs from EC2 to CloudWatch and then to OpenSearch, enabling you to collect, store, and analyze logs efficiently and effectively. And then on the Opensearch cluster, how you can perform searches on the log content to analyze the logs.
The GitHub repo for this post can be found Here. You can use the scripts in the repo to setup your own process.
Pre Requisites
Before I start the walkthrough, there are some some pre-requisites which are good to have if you want to follow along or want to try this on your own:
- Basic Terraform, AWS knowledge
- Github account to follow along with Github actions
- An AWS account.
- Terraform installed
- Terraform Cloud free account (Follow this Link)
With that out of the way, lets dive into the solution.
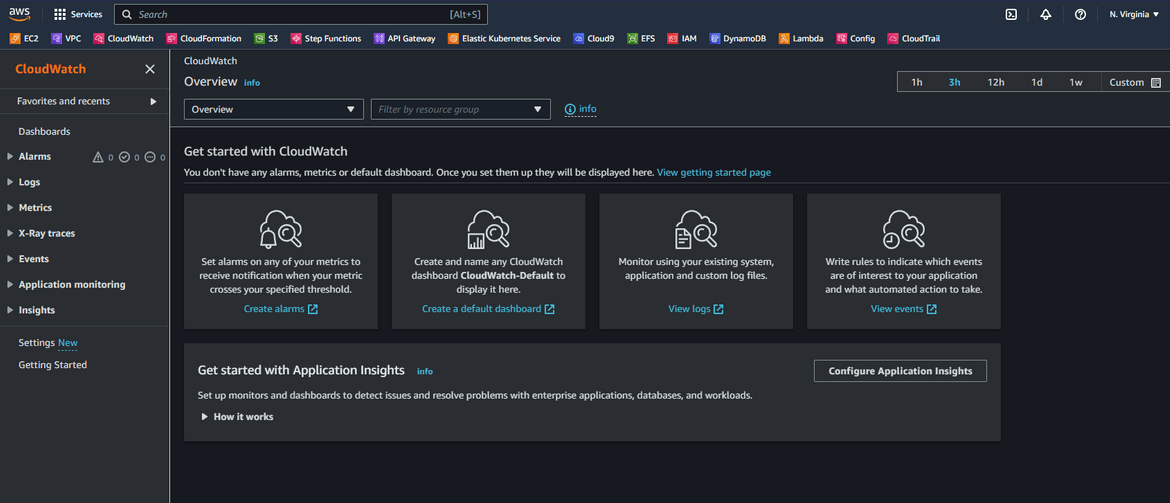
What is AWS Cloudwatch
Amazon CloudWatch is a monitoring and logging service provided by Amazon Web Services (AWS). It allows you to collect, monitor, and store metrics, logs, and events from various sources such as EC2 instances, AWS services, and custom applications. With CloudWatch, you can gain visibility into the health and performance of your resources and applications, identify and troubleshoot issues, and take automated actions based on predefined conditions. It also provides features such as dashboards, alarms, and automated actions that help you monitor and manage your infrastructure and applications effectively. In this blog post, we will discuss how the logs from EC2 can be streamed to this service.
If Opensearch doesn’t fit in the budget or planning, Cloudwatch can very well be used to centralize logs and perform efficient analysis on them.
What is AWS Opensearch
OpenSearch is a search and analytics engine that is built on top of Elasticsearch and is compatible with the Apache Lucene search library. It is an open-source, distributed search engine that allows you to store, search, and analyze large volumes of data in near real-time. OpenSearch is highly scalable, reliable, and offers a variety of search features such as full-text search, geospatial search, and faceted search. It also provides an intuitive query language, a powerful REST API, and supports a variety of plugins that can enhance its functionality. In this blog post, we will discuss how to stream log content to Opensearch so analysis can be performed on the logs.
Overall Process architecture
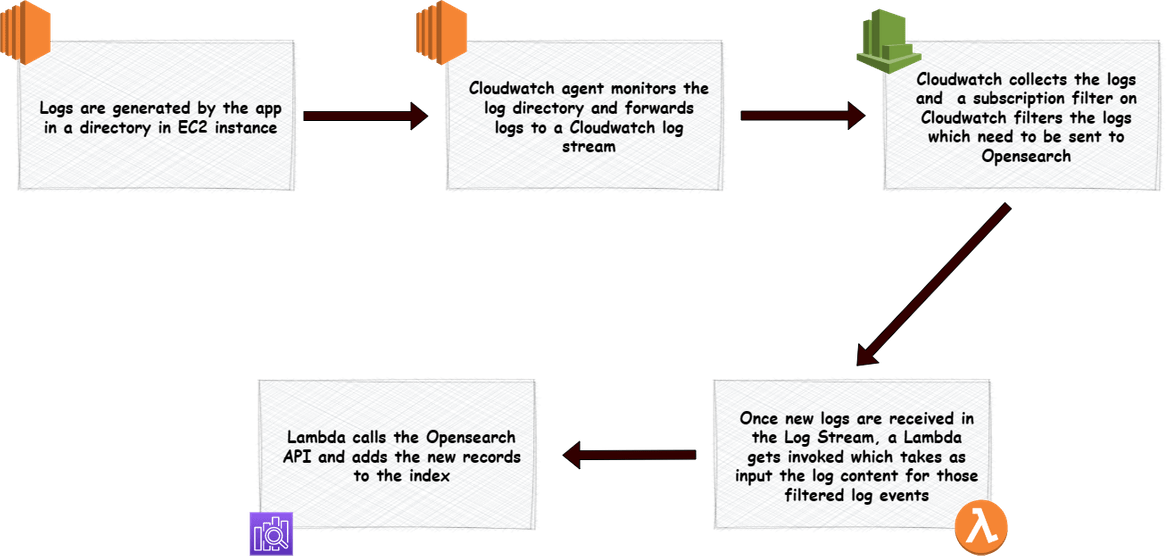
Lets now dive in to the details. I will first walk through the overall process and what all components are involved in this process. Below diagram shows how the data flow happens from the EC2 instance till Opensearch.
The process is explained in the image itself. The flow starts with generation of the app logs on an EC2 instance local directory. This directory is monitored by the local cloudwatch agent, which forwards log events to Cloudwatch as an when they get added to the log file. From Cloudwatch each new log event, triggers a Lambda function which calls the Opensearch API to crate he log event as new data in the index. The index creation happens automatically the first and doesn’t need to be handled manually. I will cover later how each of the component is created.
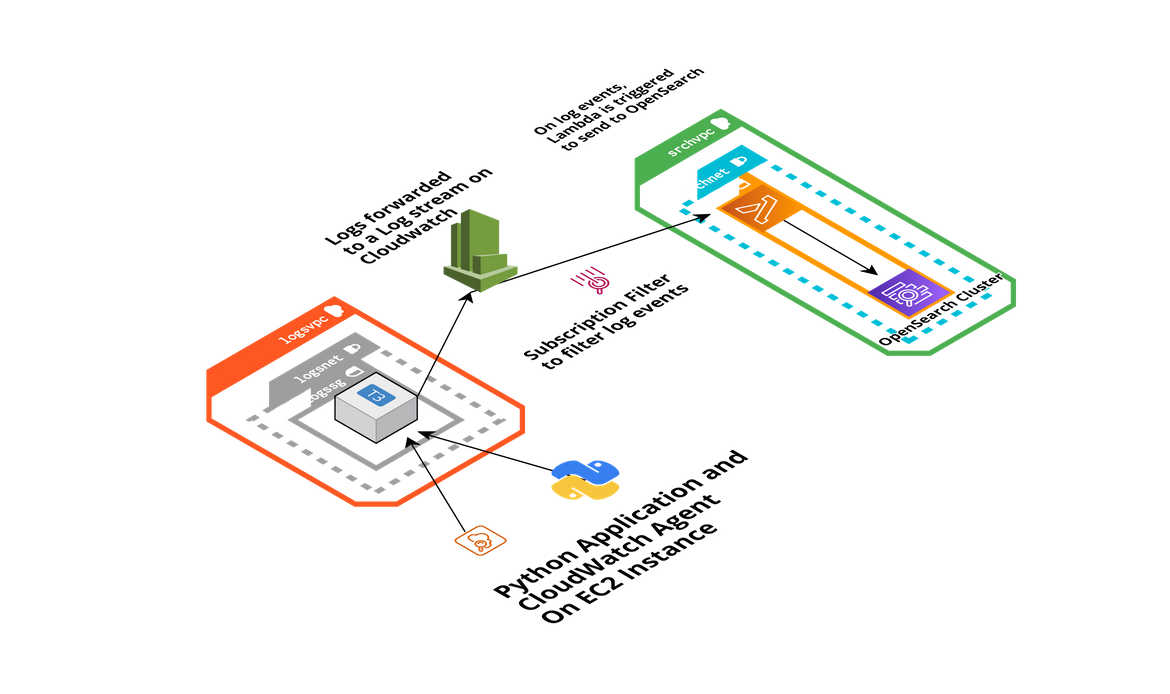
Below image shows all of the components which build this whole architecture.
Lets go through each of the components.
-
EC2 Instance: An EC2 instance is deployed which is the source for the logs. Along with the instance, there are two things also deployed on the instance:
- Cloudwatch agent: This agent is responsible for monitoring the log folder and forwarding any new log events from the log file, to a Cloudwatch log stream. For EC2 to be able to send the logs to Cloudwatch, an instance profile is attached to the instance, providing it the needed access.
- A Python app: A Python app (a sample Fast API) is deployed on the EC2 instance. This app will generate some sample logs in a local file on the EC2 instance. This will be mocking the scenario of an app generating logs
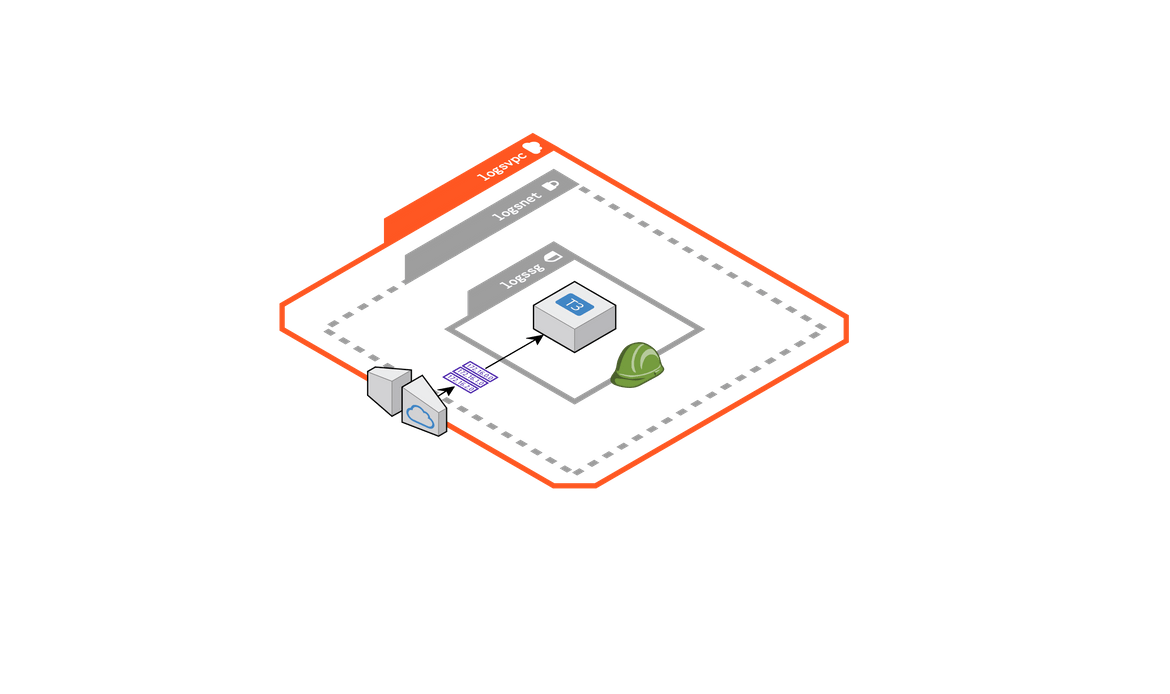
The EC2 is deployed in a VPC with internet access for this example.
- Cloudwatch Log stream: The logs from the EC2 instance gets collected in a log stream on Cloudwatch. The log stream doesn’t need to be created manually and gets created once the Cloudwatch agent starts forwarding logs. This component doesn’t require a separate configuration or setting.
- Subscription Filter: To trigger sending of the log events from the log stream, this filter is created on the Log group to filter out log events based on specific pattern. Based on this pattern the events are filtered and then those events are forwarded to the Lambda function.
- Lambda Function: Whenever there are log events which match the subscription filter above, this Lambda function is triggered. This Lambda function is responsible for reading the log content input and then calling the Opensearch API to create the Log event record. This function is assigned an execution role which provided the necessary access to access the Opensearch cluster endpoint. When this function is invoked, it creates the new log event record under the index on Opensearch. First time it auto creates the new index.
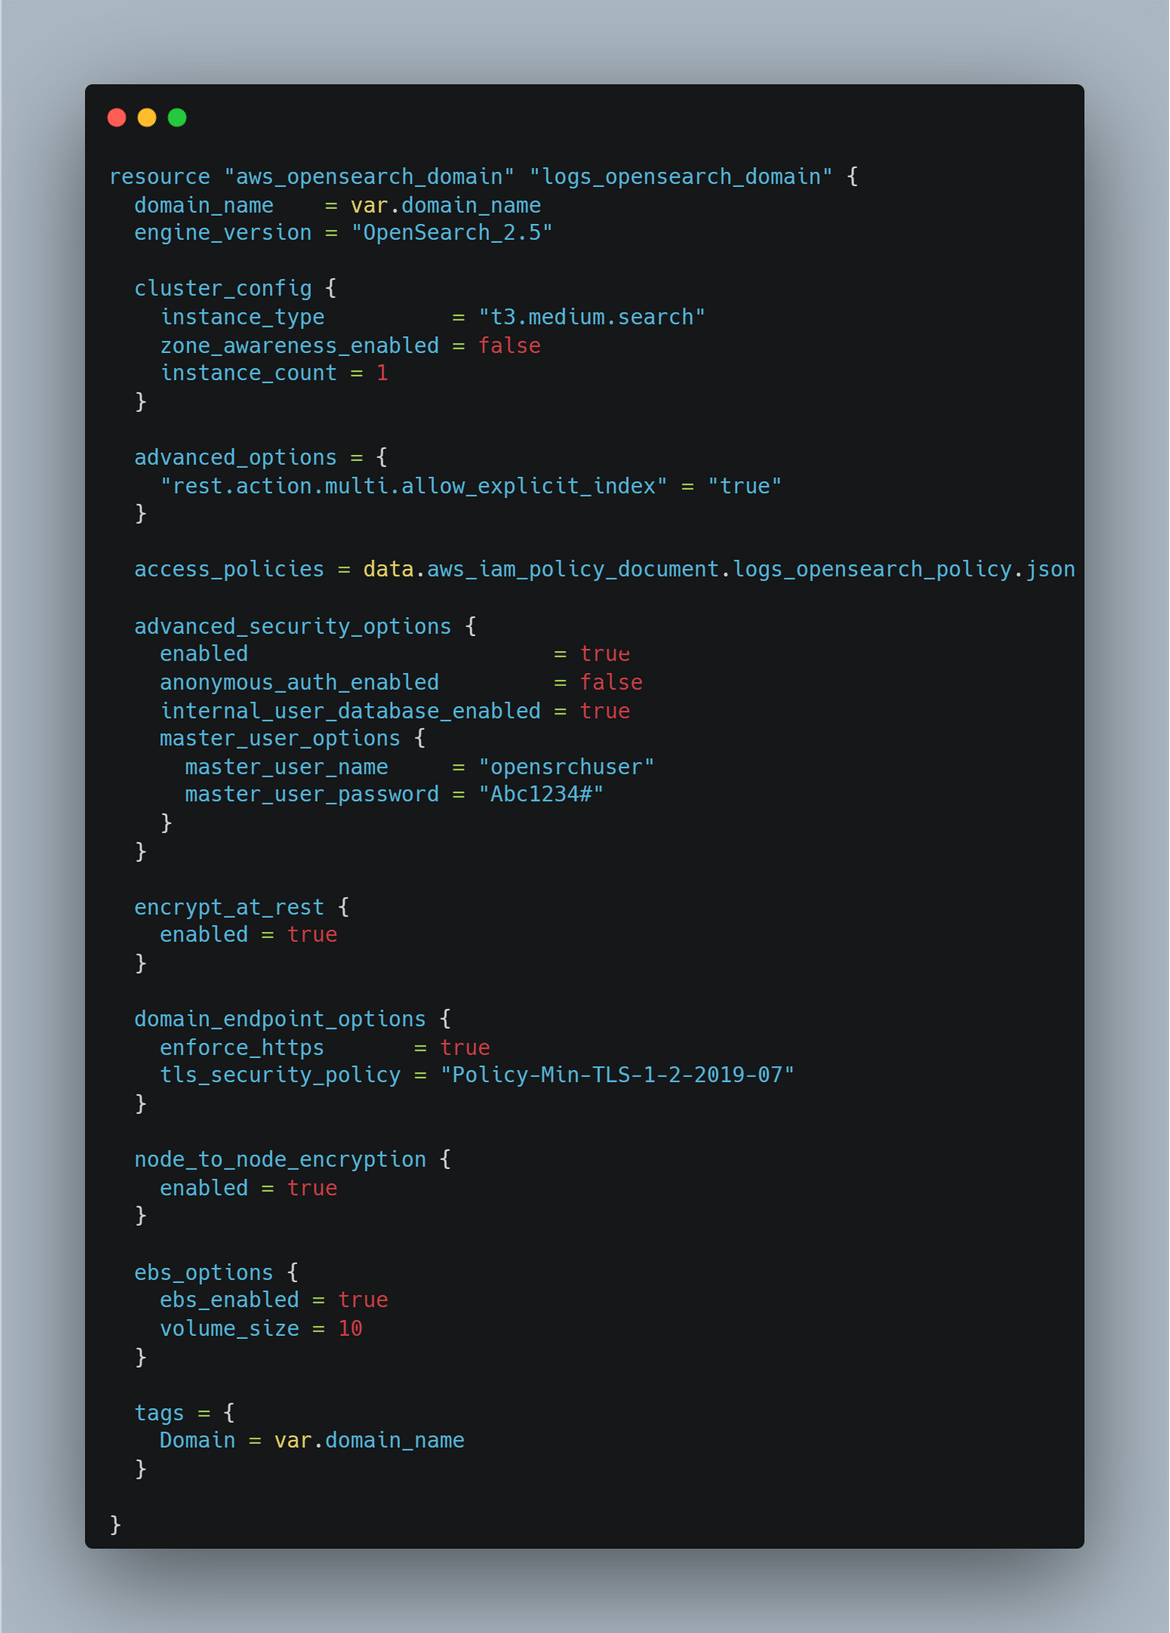
- OpenSearch Cluster: This Opensearch cluster is deployed on AWS and is reached out by the Lambda to send the Log event. The cluster is deployed with a basic authentication to enable us to login to the Opensearch dashboard and check the log events. For Lambda to be able to create records in the index, a backend role is added in the cluster which will allow the Lambda to create records. I will cover it later in the post.
That should give you a good idea about the whole process and its components. Now lets move to deploying each of these on AWS.
Deploy the Process
There are few steps to be followed to deploy all of the components and get this process up and running. Let me go through those.
Folder Structure
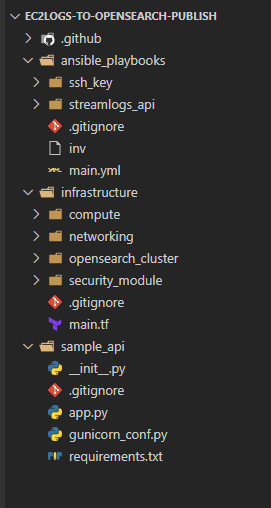
First let me explain the folder structure in my repo. If you are following along, you can use this folder structure.
- .github:This folder contains the code files for the Github workflows to deploy the infrastructure
- ansible_playbooks:This folder contains the Ansible playbook which bootstraps the EC2 instance and deploys the Python API code on it
- infrastructure:This folder contains the Terraform modules to deploy the different infrastructure components used in the whole process
- sample_api:This folder contains the Python code for the sample API which I am using to mock the log generation scenario
You can follow this structure or create your own structure as needed. To follow along, you can clone my repo and keep these folders.
Process Components
Now let me explain how I have built each of the component. The components and the bootstrapping steps are being handled using below:
- Terraform for infrastructure
- Ansible to bootstrap instance and deploy API
- Github actions to orchestrate the deployment steps
Lets go through each of the components shown above in the diagram
-
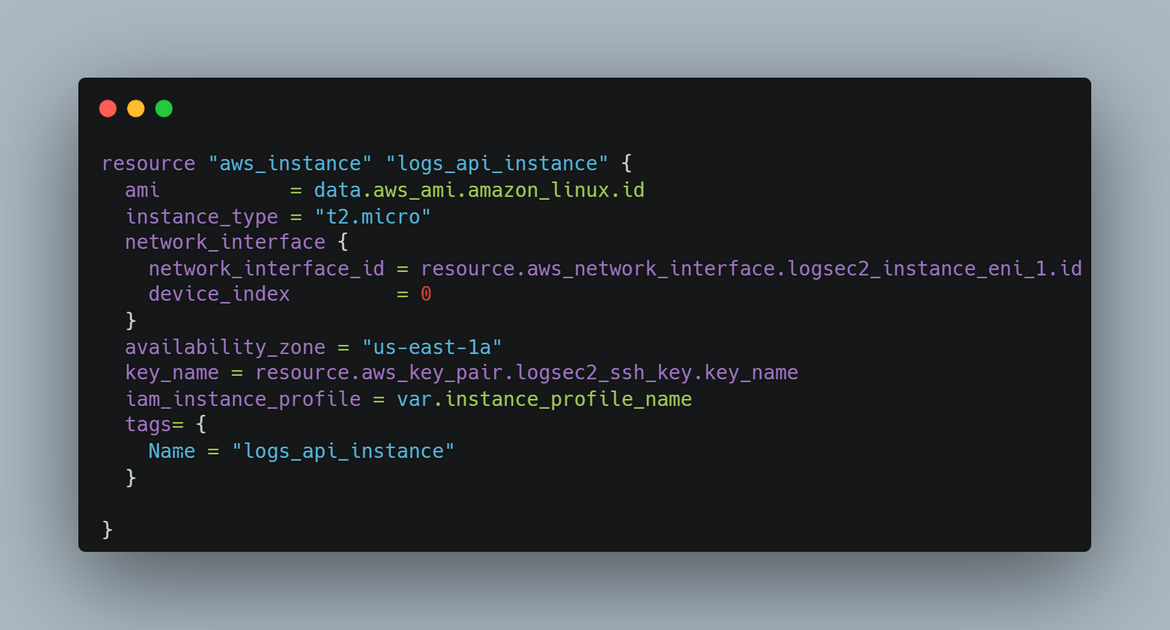
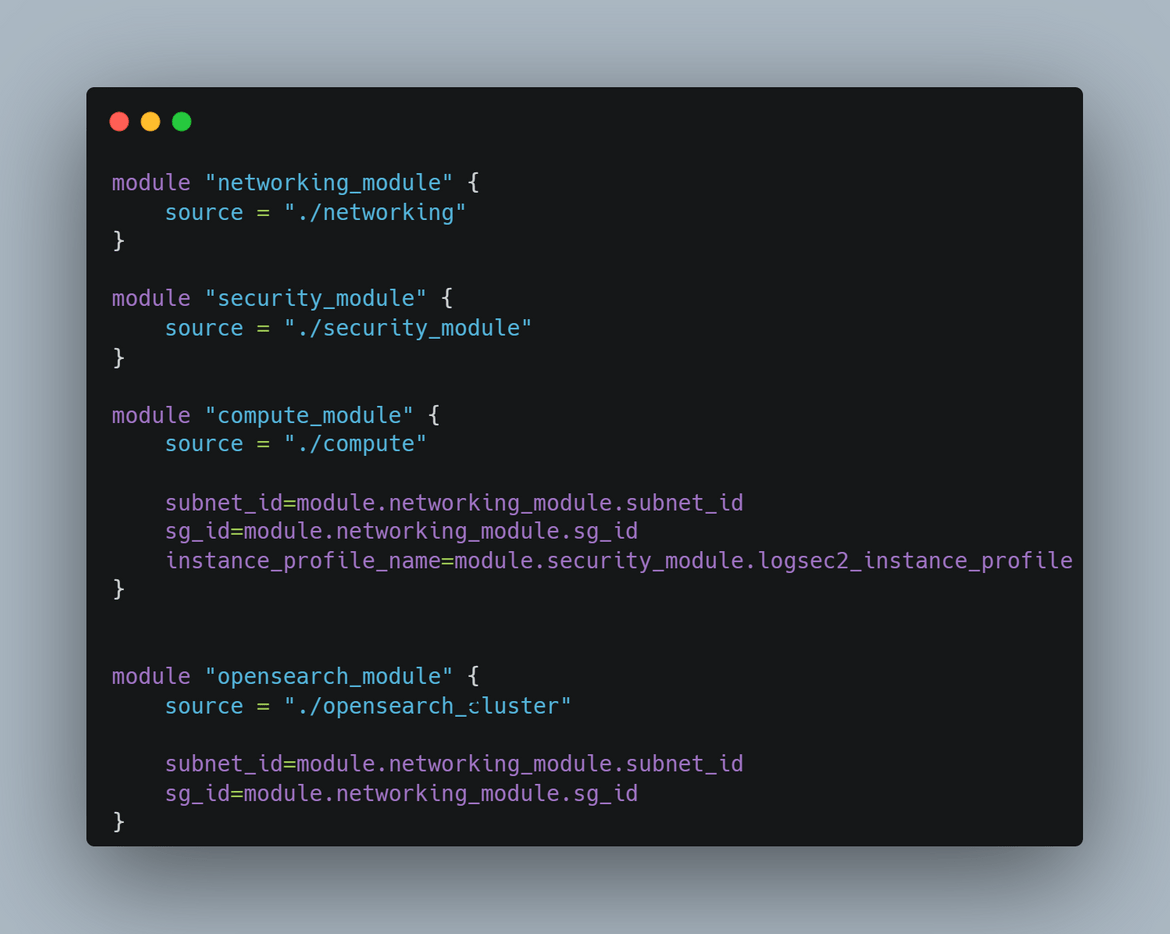
EC2 Instance and supporting infrastructure:The EC2 instance for the API is deployed using Terraform. The Terraform module is in the infrastructure folder. The Terraform module deploys these components:
- EC2 Instance
- Networking for the instance
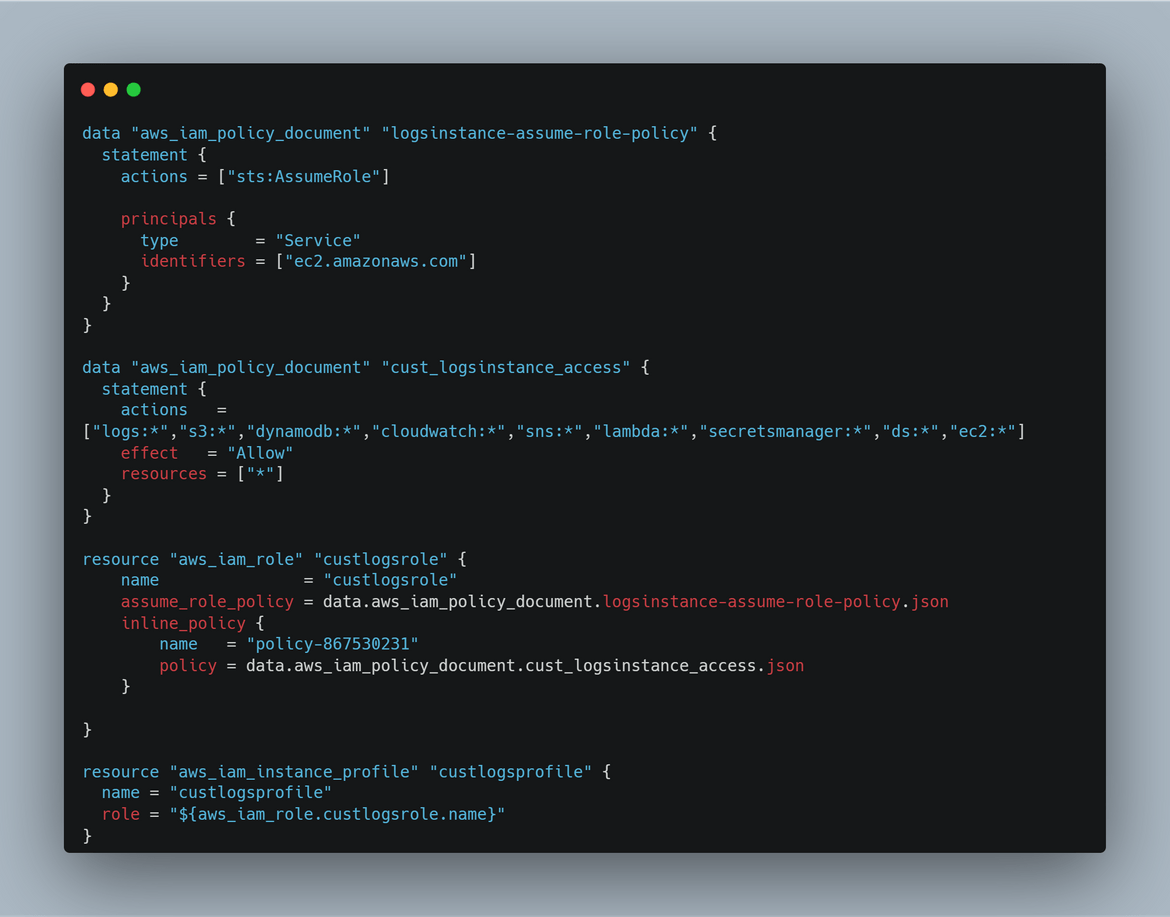
- IAM roles needed for the EC2 instance and other components of the process
For the networking, the module deploys a VPC and a subnet for the EC2 to launch in. Respective ports are opened to allow the traffic for Cloudwatch agent. This is the whole networking which gets deployed
-
Security Module: In this Terraform module, all of the IAM related components are deployed. These are the components which gets deployed in this module:
- Role for Instance profile for EC2. This gives access to the EC2 instance, for it to send logs to Cloudwatch
- Role to be used by the Lambda to send logs to Opensearch
-
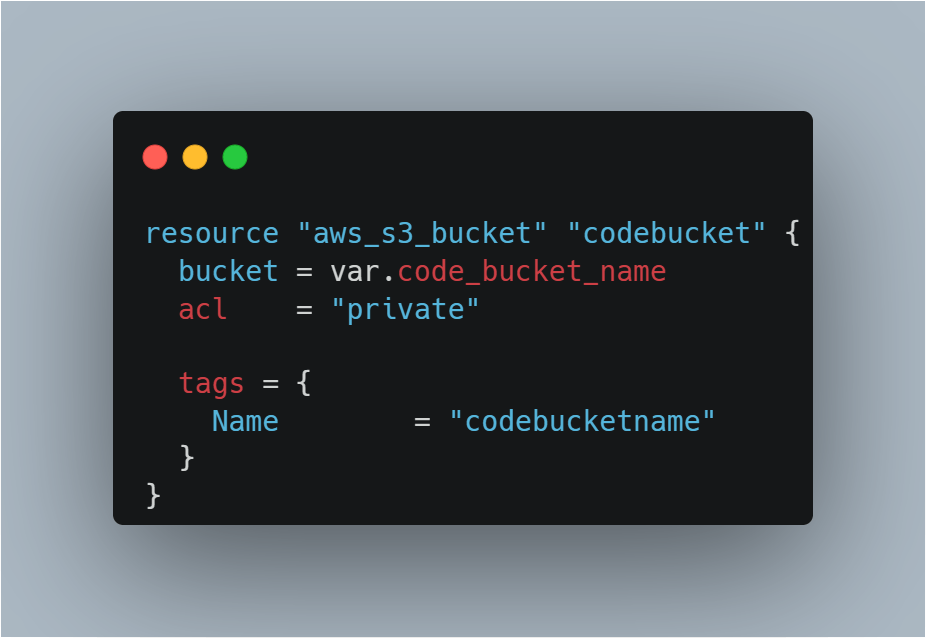
S3 Bucket for code: There is also an S3 bucket created which is needed to store the Python API code. The Terraform module also uploads the code to the S3 bucket.
-
OpenSearch Cluster: This module deploys an Opensearch cluster domain on AWS. This cluster will be used to centralize the logs from the EC2. For authentication to the cluster, I am add the option to create the master user in the cluster itself. We will use that master user to log in to the Opensearch dashboard. For this example I am not deploying the cluster in a VPC. But for proper secure clusters, it should be deployed in a VPC and not have public access endpoints.
All of the above components are deployed using a main Terraform module. Each of the module takes relevant inputs for the components.
For the Terraform backend I am using Terraform Cloud. I will explain below the steps for that. Once you have setup the Terraform cloud and updated the Terraform script with the details, if you want to deploy the modules manually, run this command in the infrastructure folder
terraform init
terraform plan
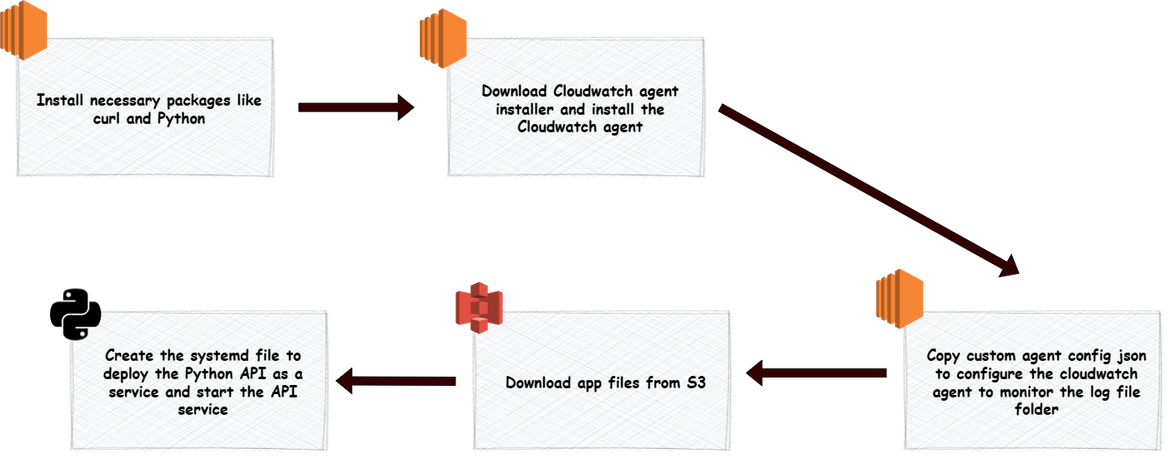
terraform apply --auto-approve- Ansible playbook to bootstrap the instance:The Ansible playbook for this is stored in the ansible_playbooks folder. Below flow shows whats handled during the bootstrapping
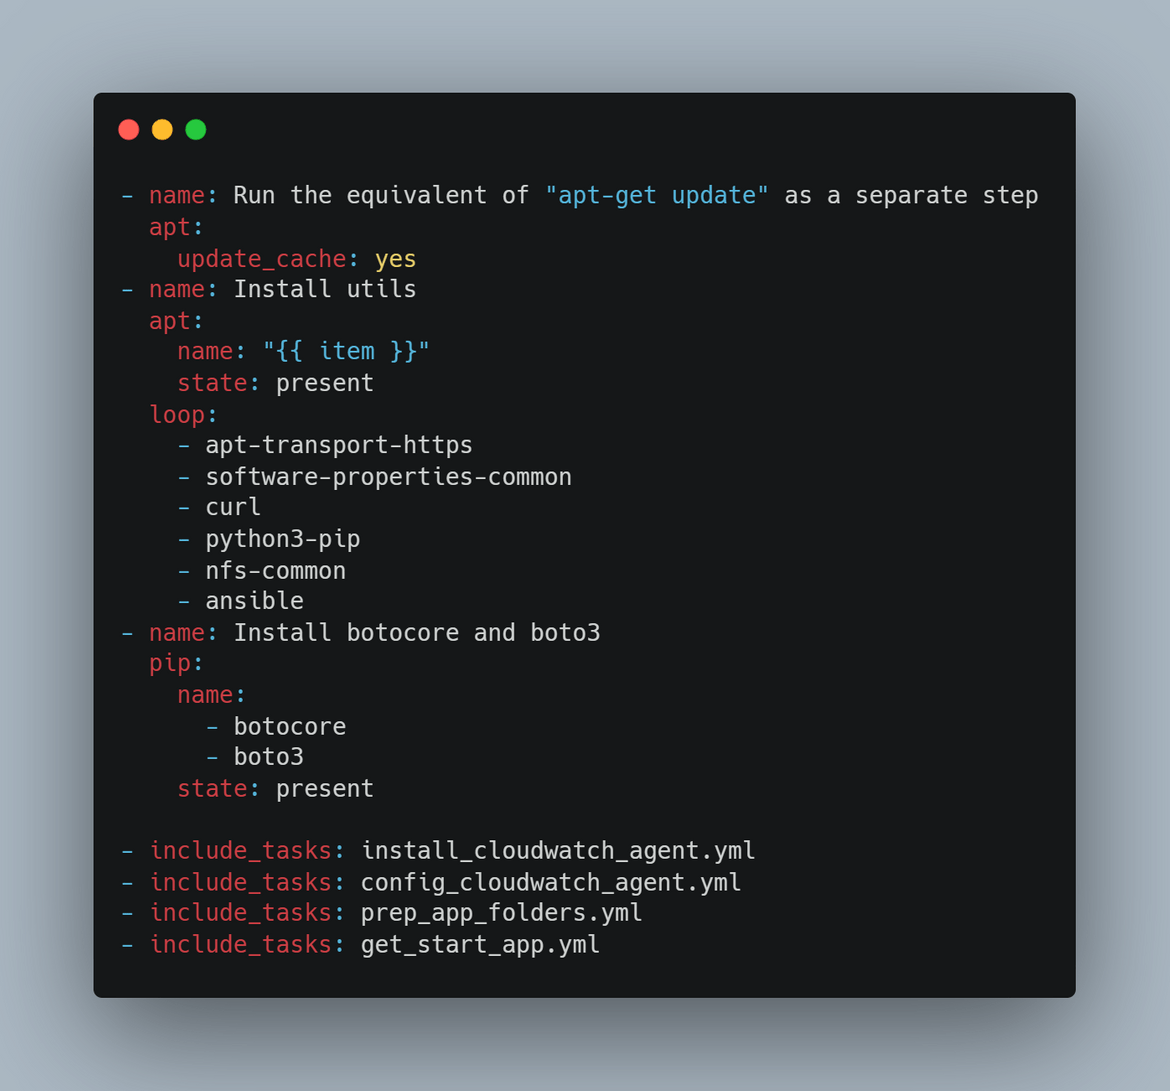
To apply the Ansible steps, a role is created. The role performs all these steps in sequence.
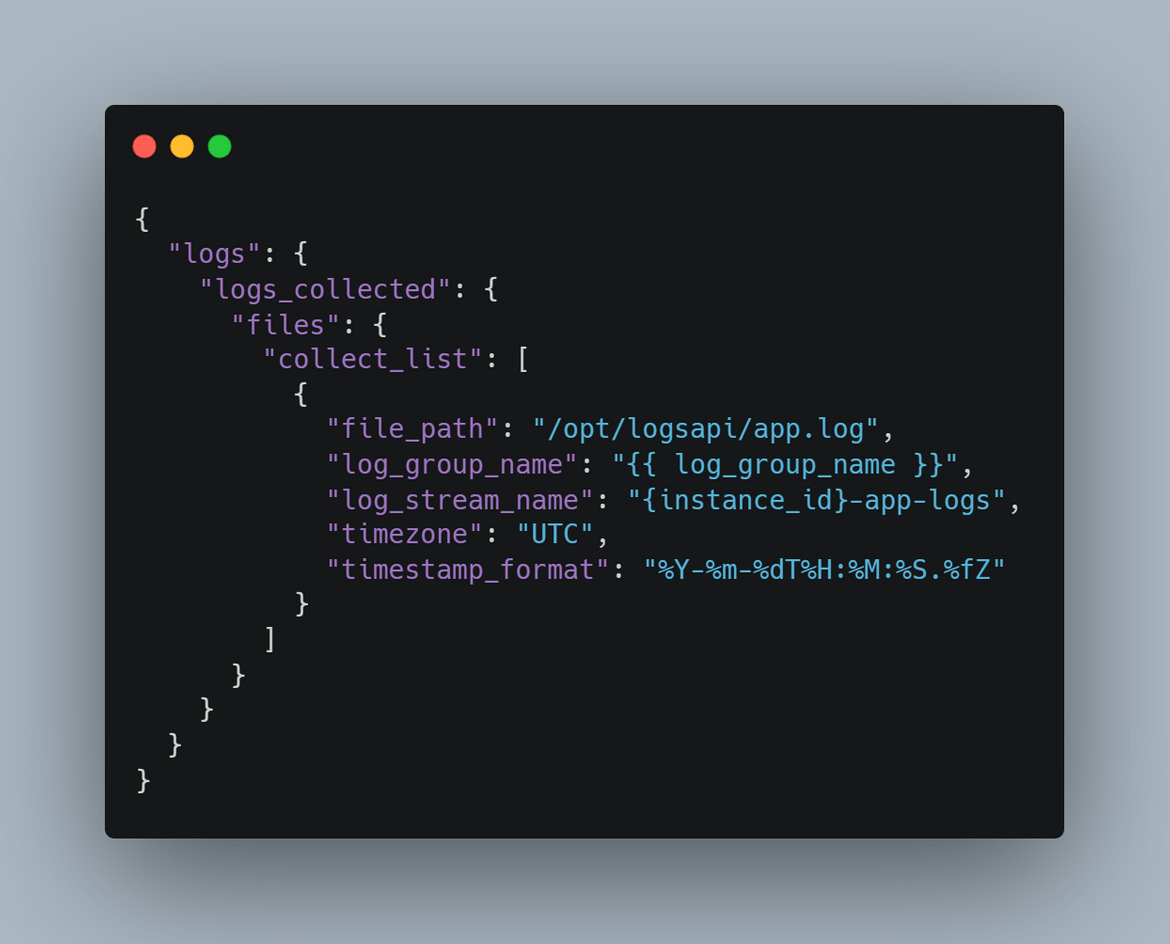
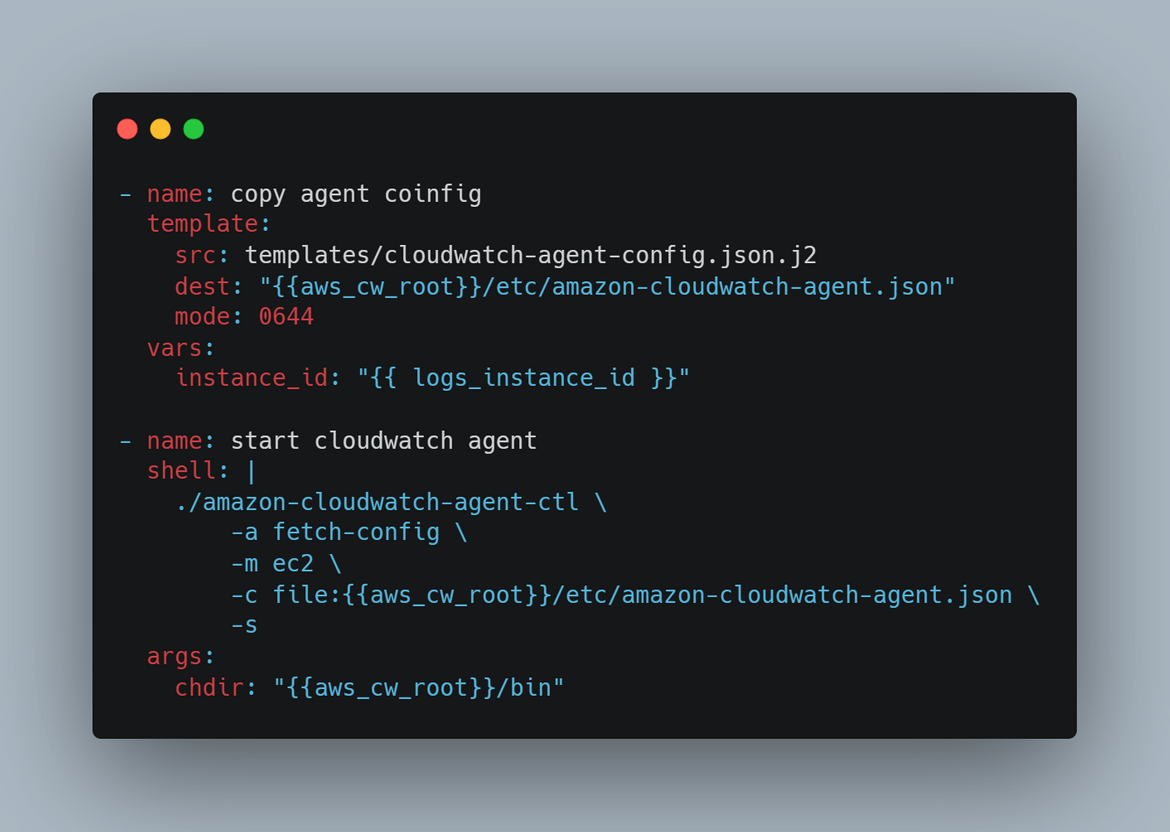
The Ansible playbook also customizes the Cloudwatch agent to monitor the specific log directory. I am using a custom agent config json template which is in the templates folder. This agent config gets copied to the target instance to configure the cloudwatch agent. This file can be edited to add any other changes.
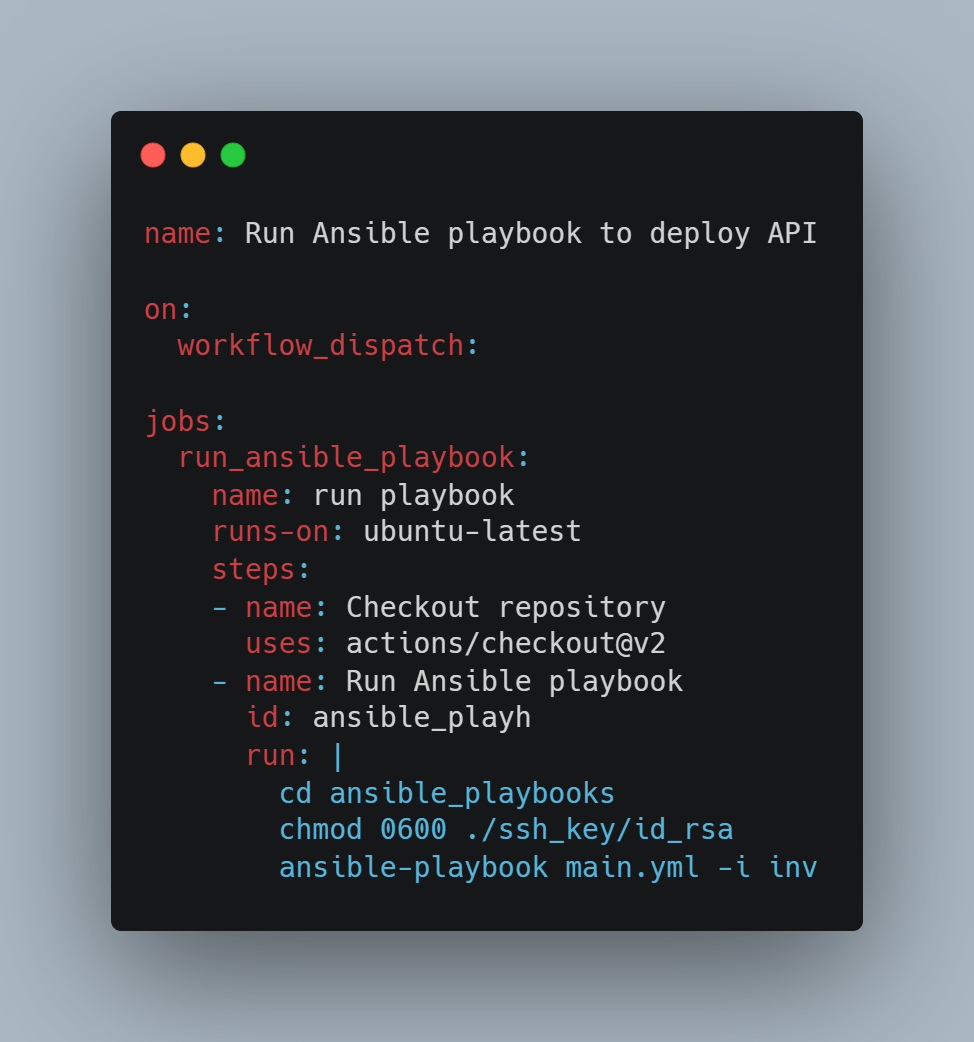
In this example, to connect to the target system, I am using sshkeys which is expected to be present in the sshkey folder. It is not a good practice though and the keys have to be in a secure location from where it can be read. The target system details are specific in the inventory file ‘inv’. If you want to apply the Ansible role to an Instance, copy the ssh key in the ssh_key folder and copy the instance IP in the inv file. Then run this command to apply the role to that instance and perform the bootstrapping.
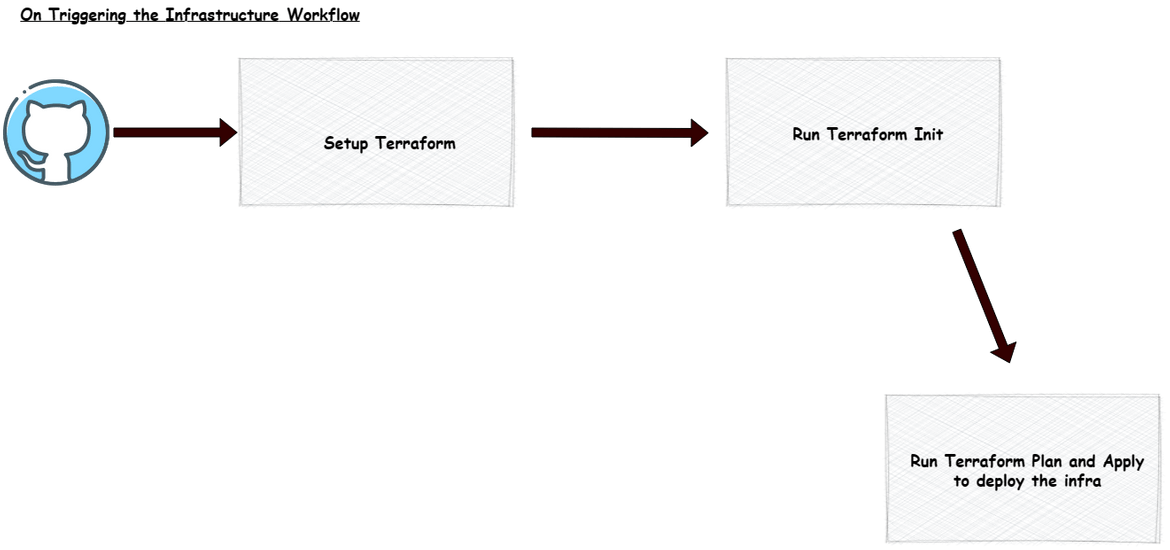
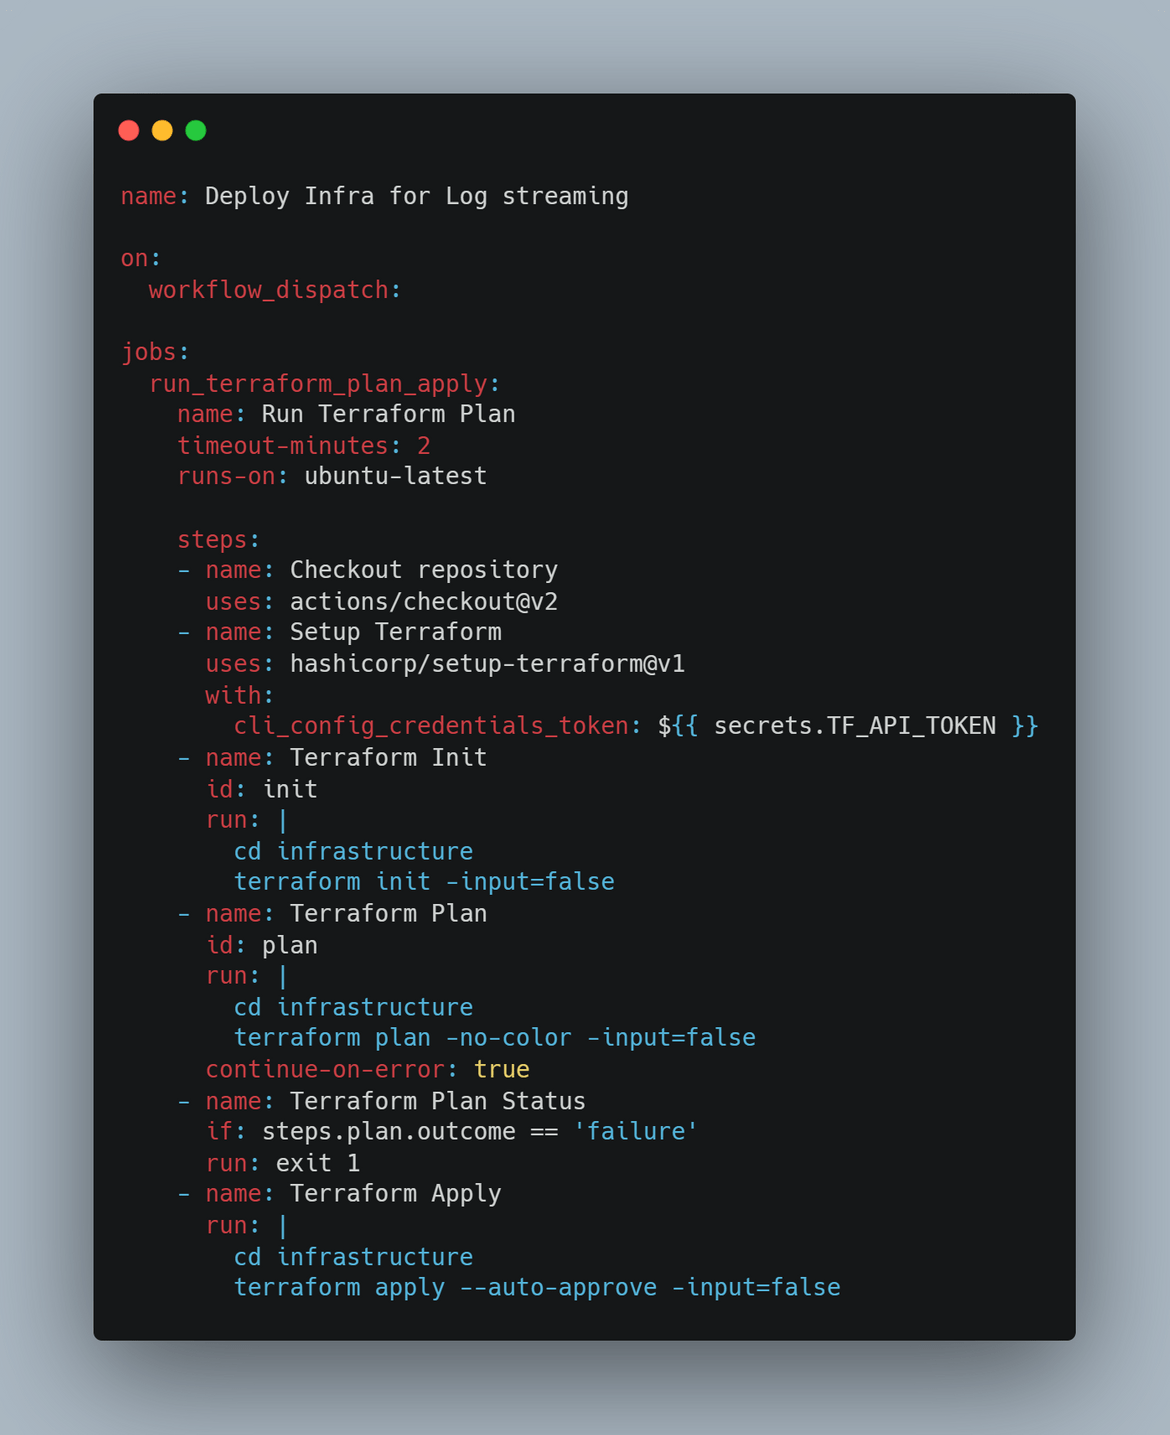
ansible-playbook main.yml -i inv All of the above component deployments are orchestrated using a Github actions workflow. The workflow handles spinning up the infrastructure and bootstrapping thge instance to deploy the API. Below flow is handled in the Github actions workflow.
Above flow is triggered on running the workflow to deploy the infrastructure.
- When triggered, as first step, the Terraform is setup in Actions for the subsequent steps to run
- Then the workflow goes through the Terraform steps of Init, Plan and Apply. The AWS credentials are passed as environment variables from the secret setup on Github actions
- For Terraform to connect to Terraform cloud from the workflow, a Terraform cloud token is generated and stored as secret in Actions
After the infrastructure is deployed, we will need to bootstrap the instance and deploy the API on it. Another Github actions workflow is built for this which is triggered to run the Ansible playbook. Since for this example I am storing the ssh key in the folder in repo, the workflow involves running the Ansible command to run the playbook on the target instance after the instance public ip is updated in the inv file.
That covers all of the components which we will be deploying in next step to make the whole process functional. Lets move on to deploying each.
Deploy the whole stack
Before we start the deployment, there are few initial pre-steps which are needed to be performed. These steps are needed to setup different credentials needed in each step.
- Create AWS IAM User:I wouldn’t go through detailed steps to create the IAM user. But an IAM user needs to be created with enough permissions to deploy the infrastructure stack. The access keys for the IAM user need to be noted down for next step

- Register for Terraform cloud:If you are following my scripts, then Terraform cloud will be needed for the backend. If you already have a backend setup or your own method, this step is not needed. Follow the steps Here to register and setup your own Terraform cloud account and project. Its free.
- Add AWS Credentials on Terraform cloud:For Terraform cloud to be able to deploy to AWS, the Access keys created above need to be passed as environment variables in the workspace

- Terraform Cloud token on Github actions:For Github actions to run the Terraform steps, it needs an API token to connect to Terraform cloud. Create your own API token on Terraform cloud console
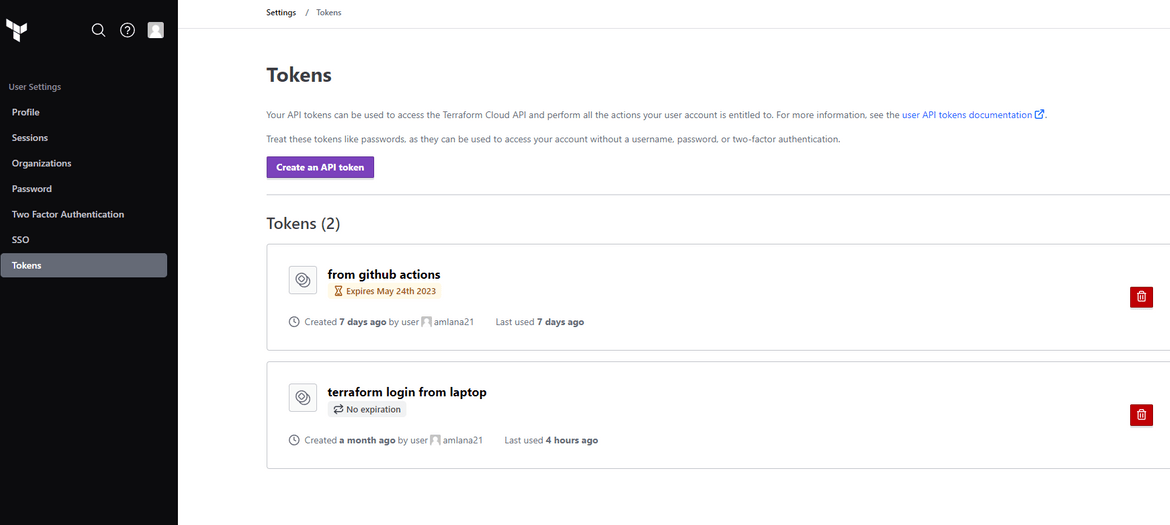
The token created need to be added as an actions secret on the Github repository.
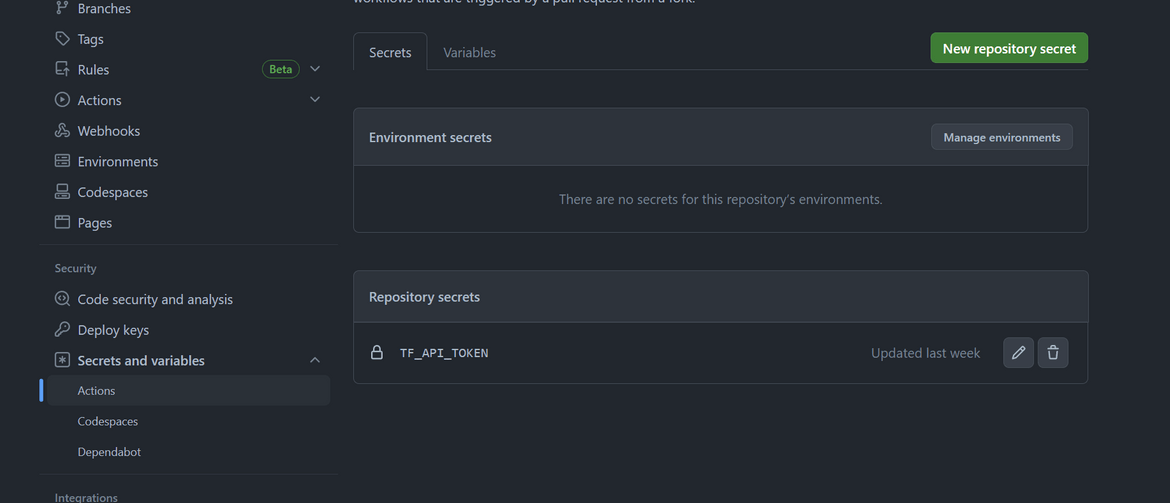
These steps will ensure rest of the things going smoothly. Lets start deploying.
-
Deploy the Infrastructure
To deploy the infrastructure, we will first run the Github actions workflow for the infrastructure. Navigate to the Actions tab of the Github repo and run the workflow. Success of the step depends on completion of above pre-requisites

This will trigger the workflow and start creating the infrastructure on AWS.
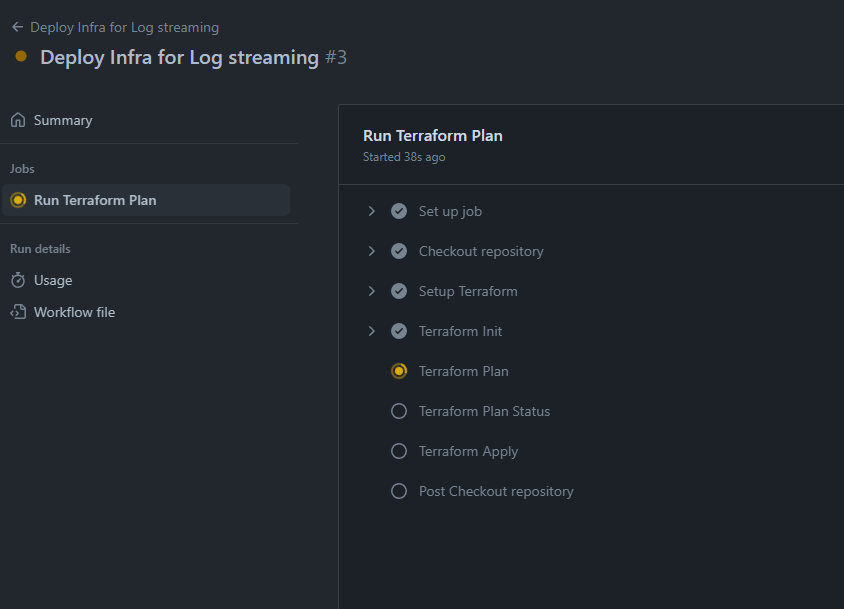
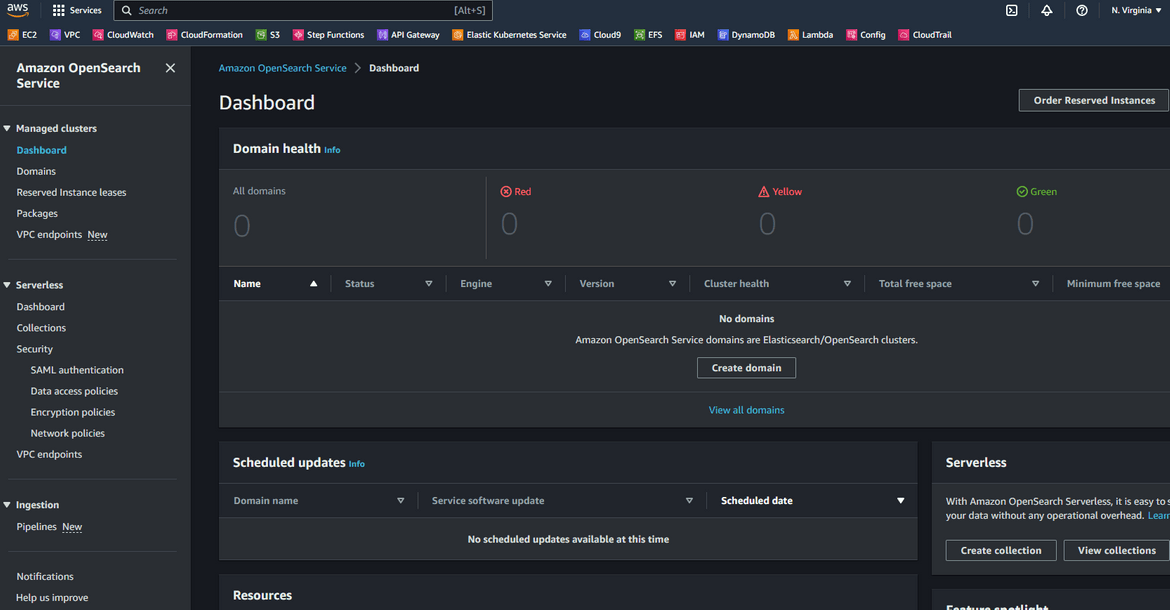
This will take a while to complete as Opensearch cluster takes a while to get created. Track the status on Terraform cloud console.

Once the creation completes, the workflow will show success on Github actions and the Terraform cloud run will also get finished
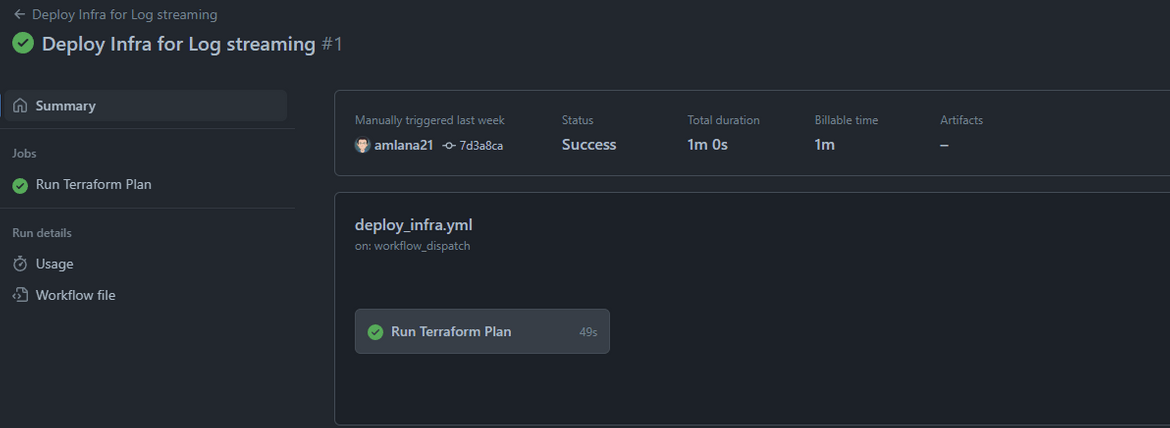

Lets check some of the resources on AWS
EC2 Instance
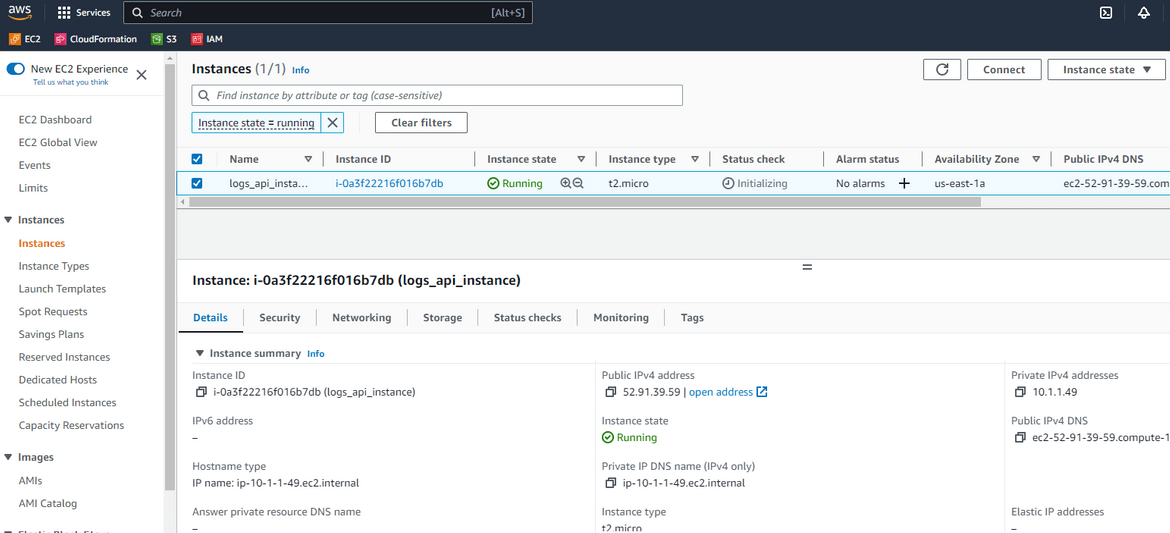
Make sure to note down the public DNS or IP of this instance which we will need next.
Opensearch cluster

Python code in S3 Bucket
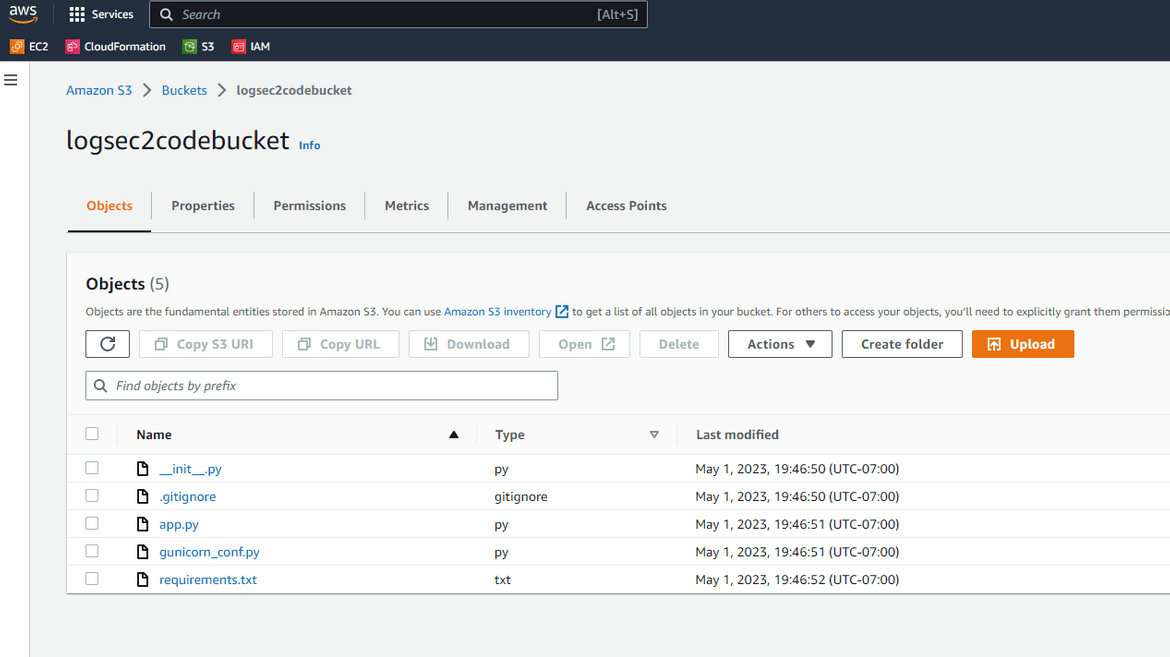
-
Bootstrap the instance
Now we have the EC2 instance up and running. Lets bootstrap the instance. Copy the public IP or DNS which you copied earlier, and paste it in the env file in the ansible playbooks folder. Then push the change to repo. Once done, navigate to the Actions tab and run the bootstrap workflow.

This will start the bootstrap process.
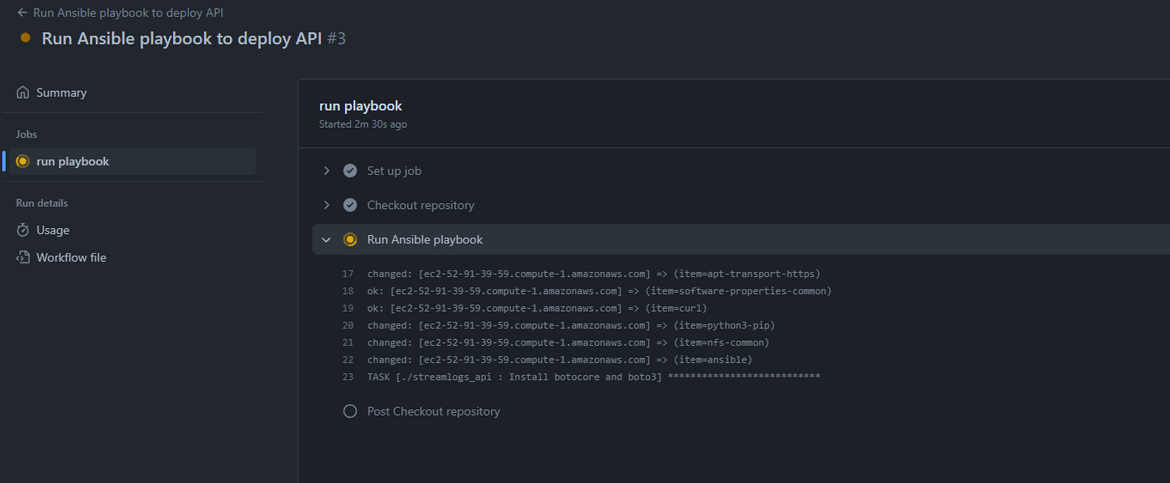
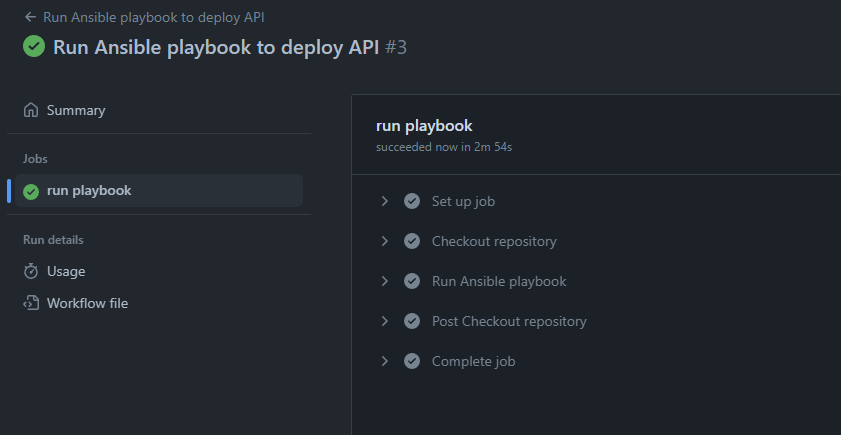
Now that the workflow is success, we should be able to test that the API is running properly. Navigate to the port 5000 of the EC2 public URL and it should show the API ping response

Lets generate some logs. In the API I have created an endpoint which generates random logs when invoked. Here I am invoking the API endpoint few times to generate some logs.

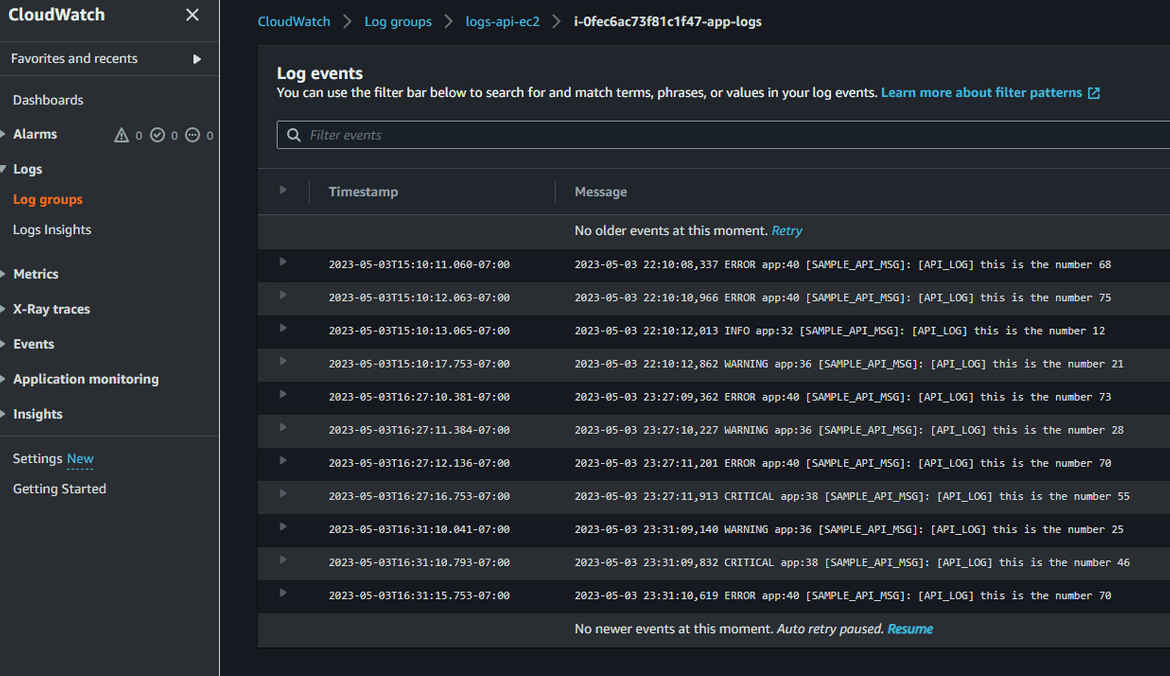
Since the API was invoked, and we already have the Cloudwatch agent setup, the logs should start getting delivered to the Log stream. Lets view the logs on Cloudwatch. Navigate to the log stream on Cloudwatch. The log stream name can be found from the agent config file.
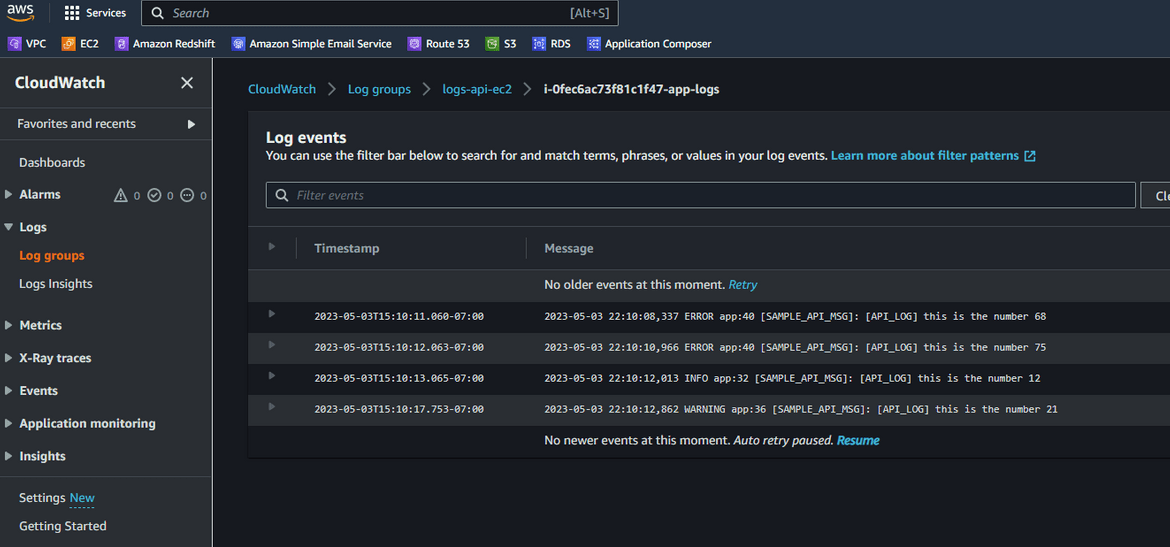
Now we have the logs getting delivered to the Cloudwatch log stream. Next we will have to get these log content to the Opensearch cluster. Before we can do that, we will have to do some setups on the Opensearch cluster to allow the Lambda to send logs from Cloudwatch to the cluster.
-
Allow Cluster access to the Lambda role
To forward the logs from Cloudwatch to Opensearch, the Lambda role will need edit access in the cluster so that it can create necessary indices, and add log content rows to the >indices. Follow these steps to add the access:
- Login to the Opensearch dashboard. The URL for the dashboard can be found on the Opensearch service page which was deployed on AWS

- Login to the dashboard using the credentials which was mentioned in the Terraform module script
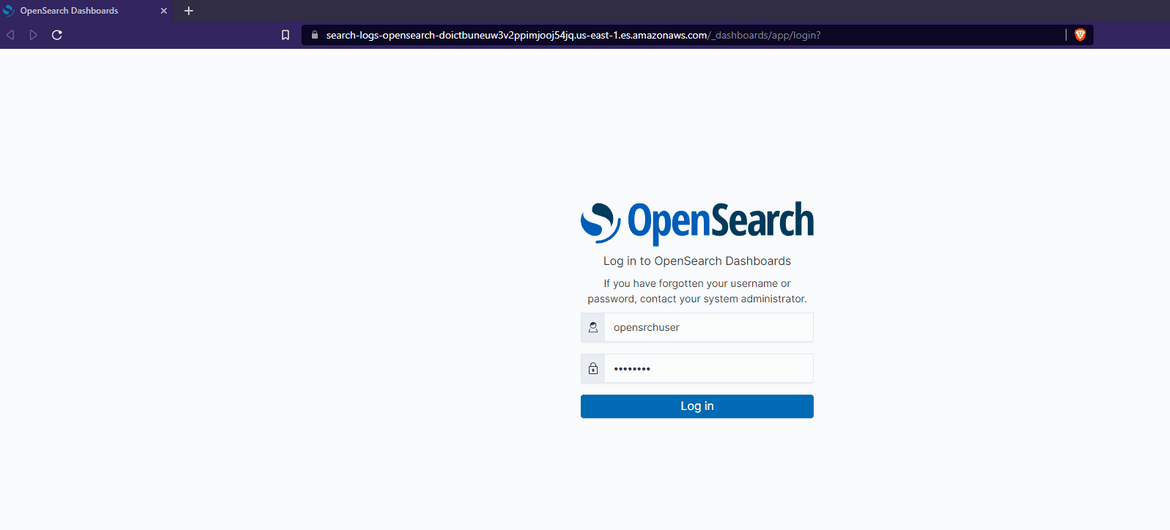
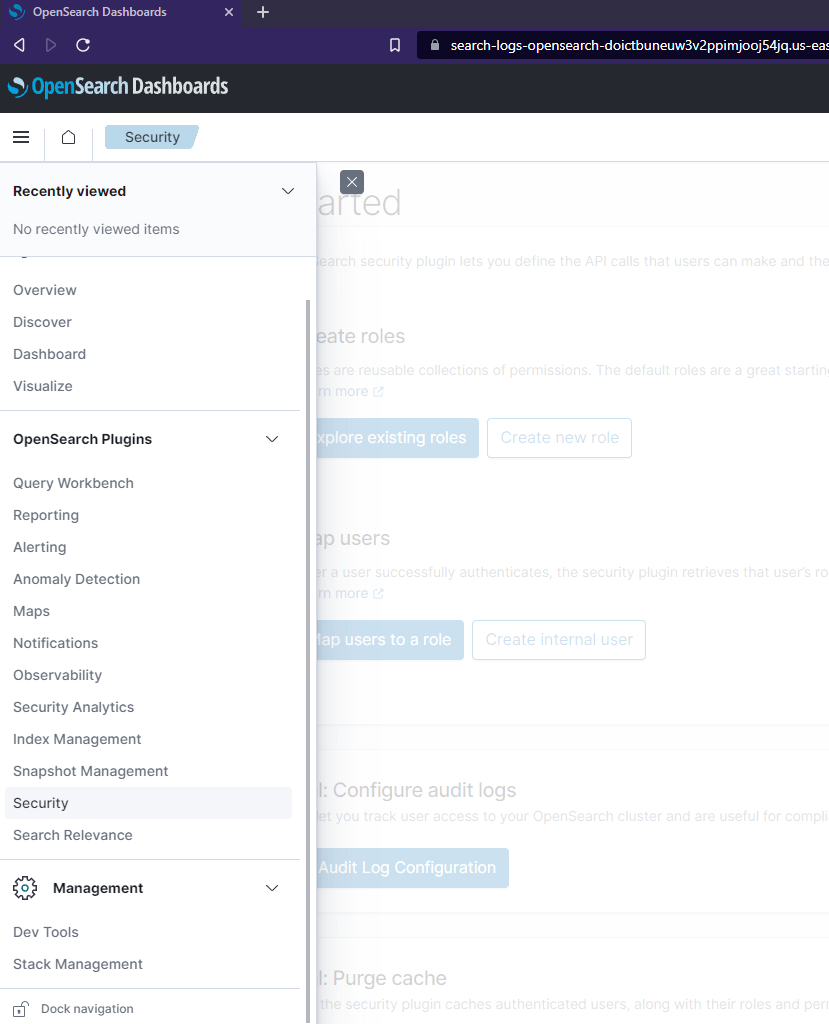
- Once logged in, navigate to the Security tab from the menu
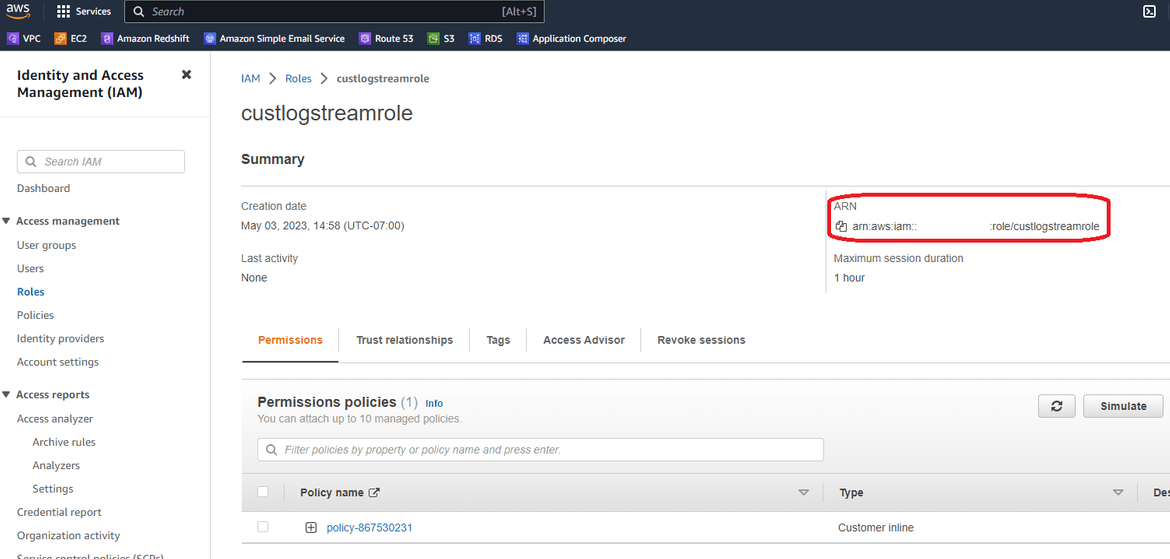
- On a separate tab open AWS and navigate to IAM. Open up the IAM role which was created by Terraform and will be used by the Lambda as execution role. This role will provide Lambda access to Cloudwatch and Opensearch. From the role page, copy the ARN and keep it for next steps
- On Opensearch page, navigate to thr Roles tab and open the ‘all_access’ role. Navigate to Mapped users tab
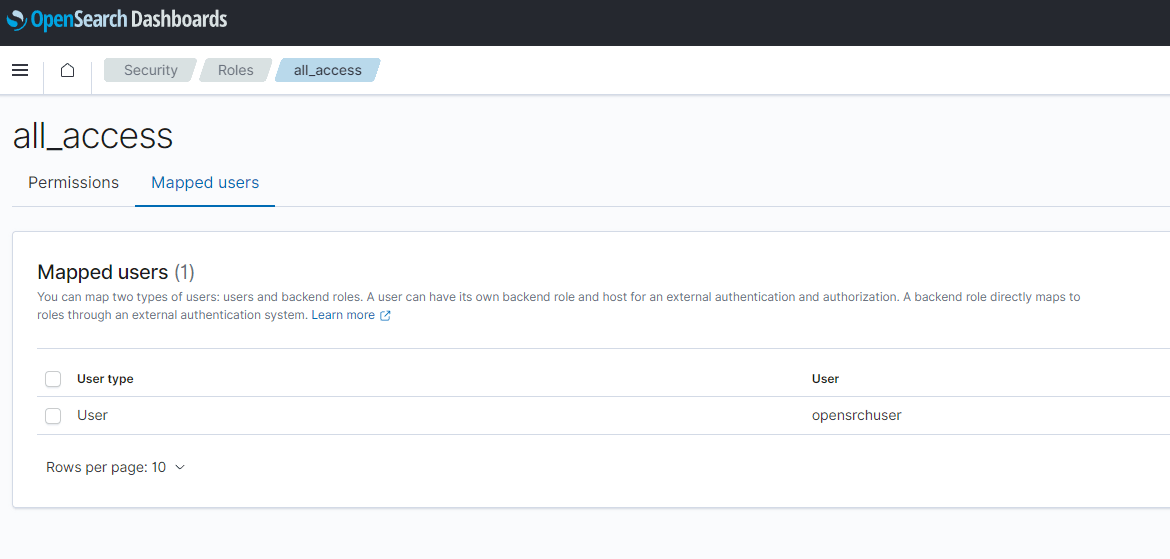
- Click on Manage mapping button. It will open the map page. Paste the IAM role ARN copied above, in the Backend roles field. Click on Map to save the value.
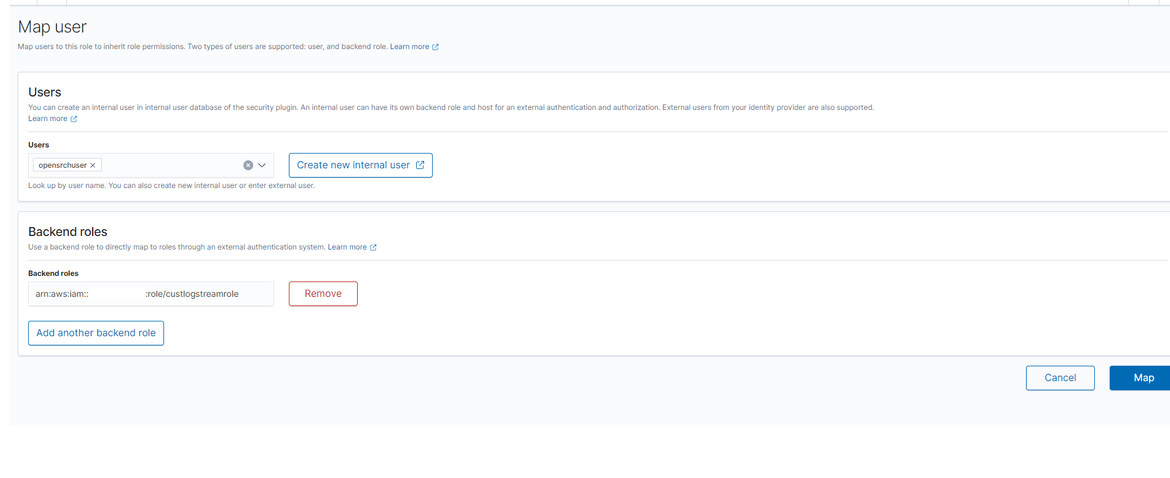
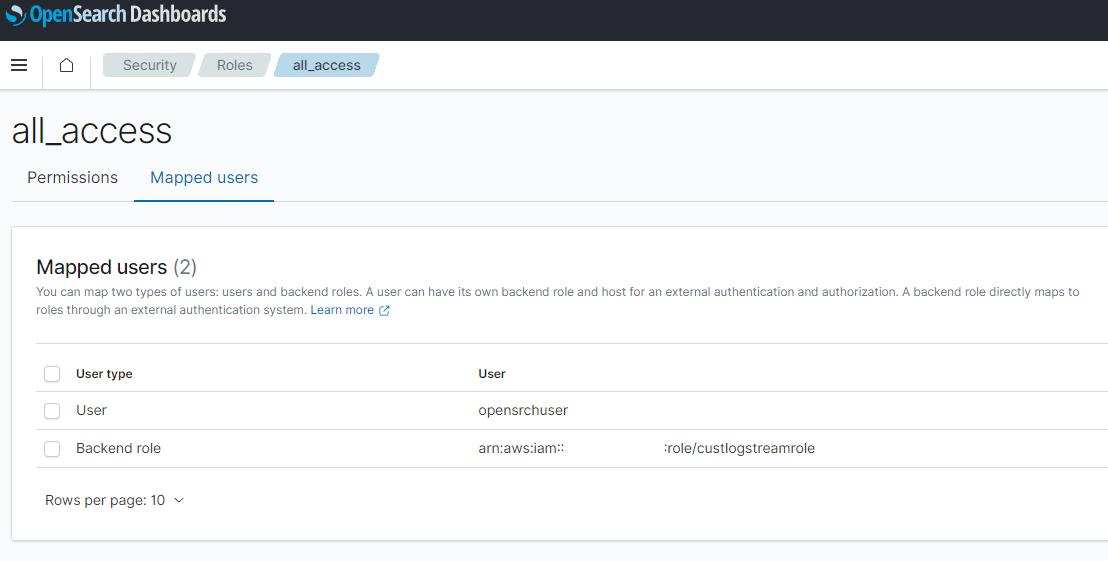
This completes providing edit access to the Lambda on the Opensearch indices.
- Login to the Opensearch dashboard. The URL for the dashboard can be found on the Opensearch service page which was deployed on AWS
-
Create Subscription Filter for Log Stream
To forward the logs from Cloudwatch to Opensearch, a subscription filter needs to be created on the log stream. The filter will filter the log contents based on the pattern and forward the contents to the Lambda. The Lambda doesn’t need to be created separately as it will get created automatically based on the steps below.
- Navigate to Cloudwatch and open the respective Log group which contains the logs from the EC2 instance. We saw the example above
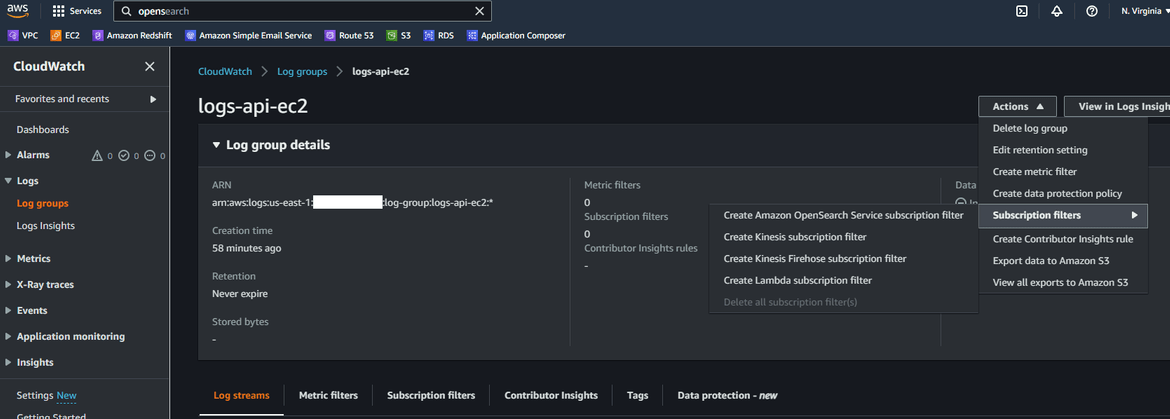
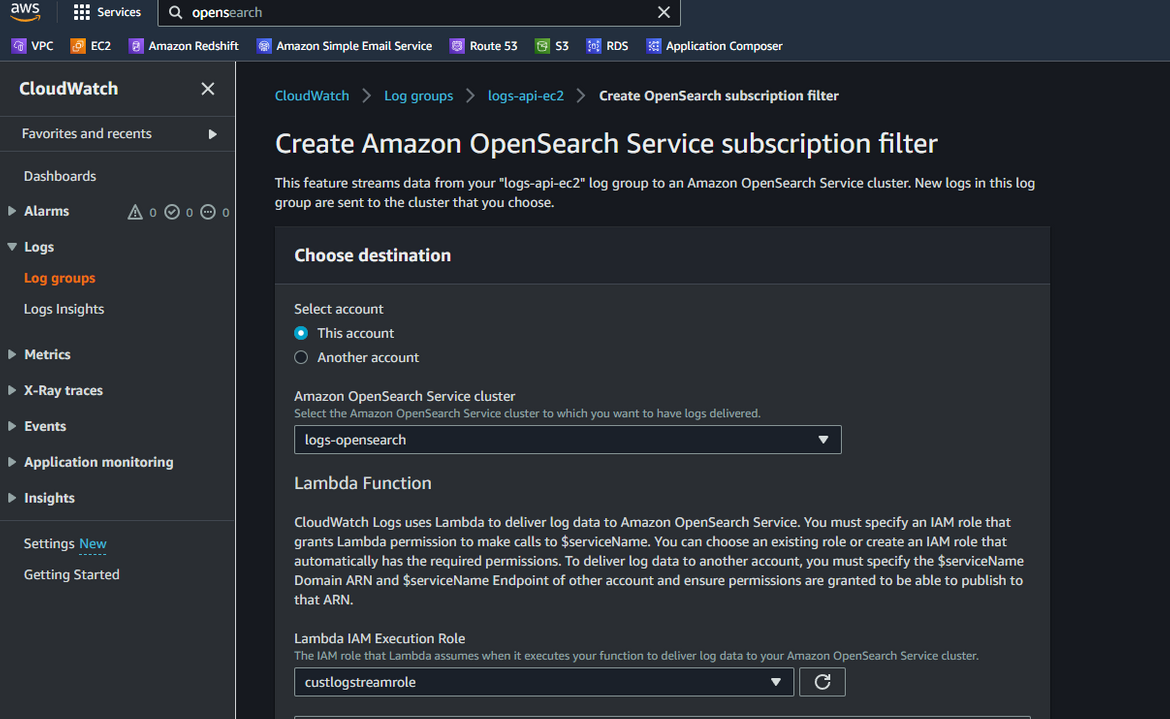
- On the log group page, click on the new subscription filter option and click on Create Amazon Opensearch service subscription filter
- On next steps, we will configure the streaming. In next page, select the Opensearch cluster name, which was created earlier by the Terraform apply. Also make sure to select the Lambda role which was created. This is the same role which was given access in the Opensearch cluster.
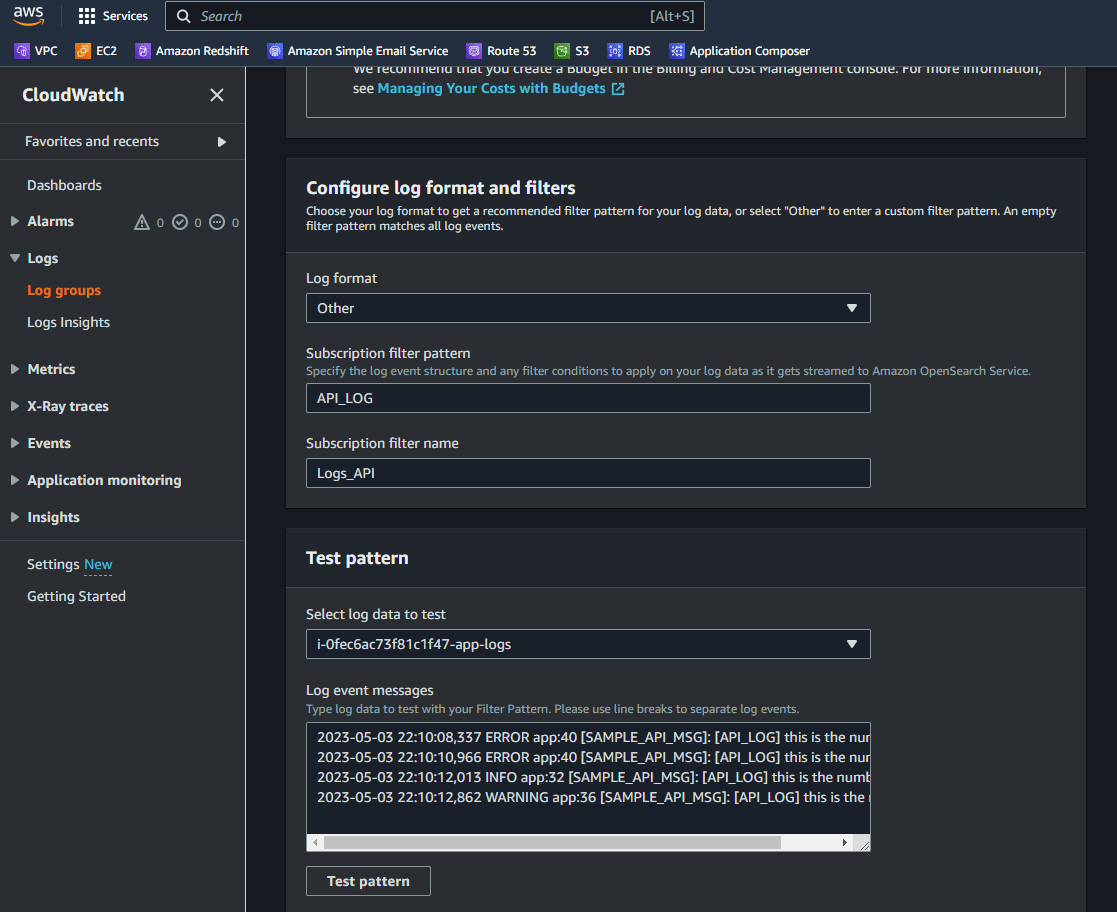
- Next update the pattern which will be used to filter content from the logs. Here I am using a pattern to look for a specific text in the log lines. Click on Test pattern to make sure proper log lines are returned
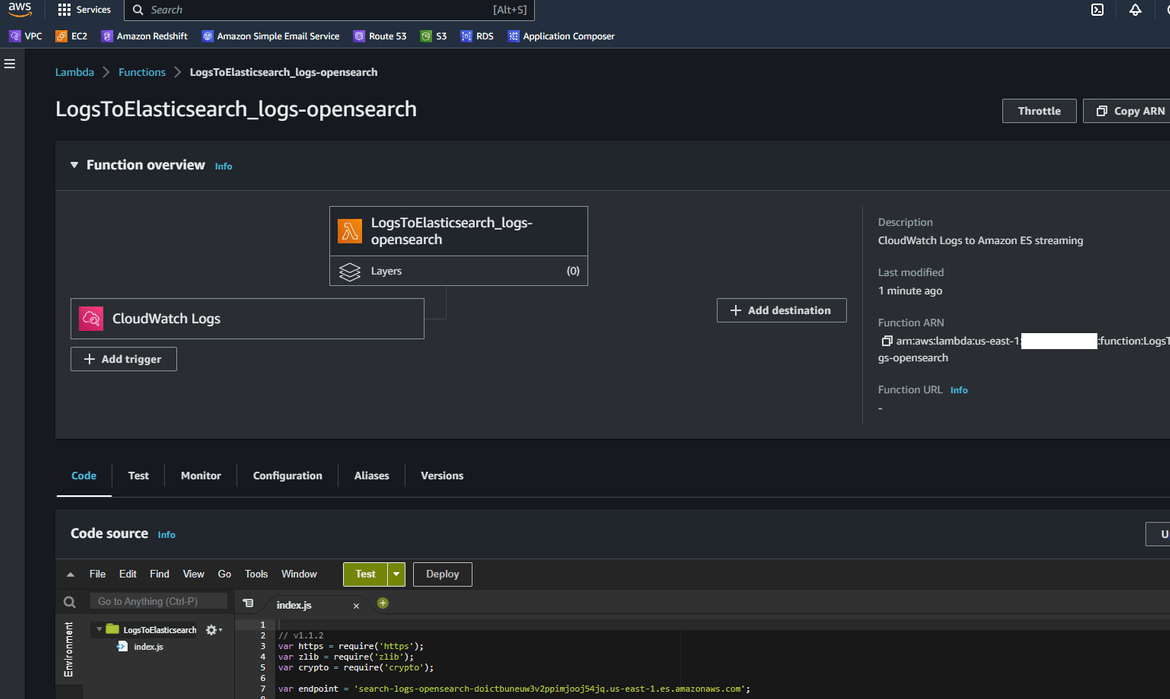
- Click on Start streaming button. It will take a while to complete the setup. Once complete, it will show a confirmation. You can verify the setup by navigating to lambda page and looking for Opensearch Lambda. A new Lambda will have been created.
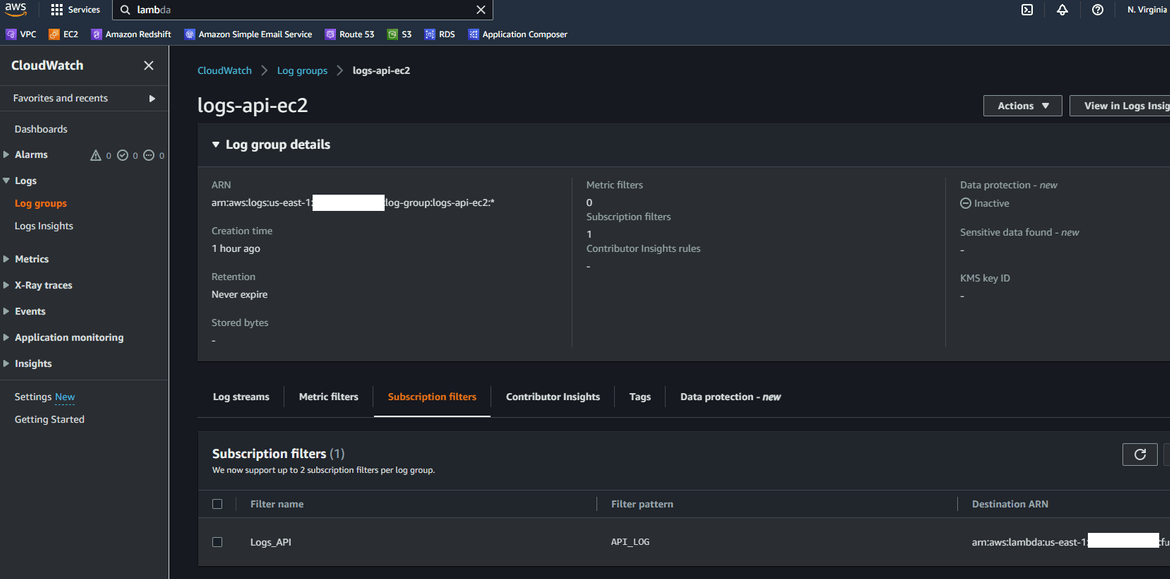
- The new subscription filter can be checked on the Log group
Now we have the streaming from the Cloudwatch log group to Opensearch cluster up and running. Lets see how it works.
Demo
To verify the log streaming, first lets generate some logs. Here I am invoking the API endpoint which will generate some random logs.
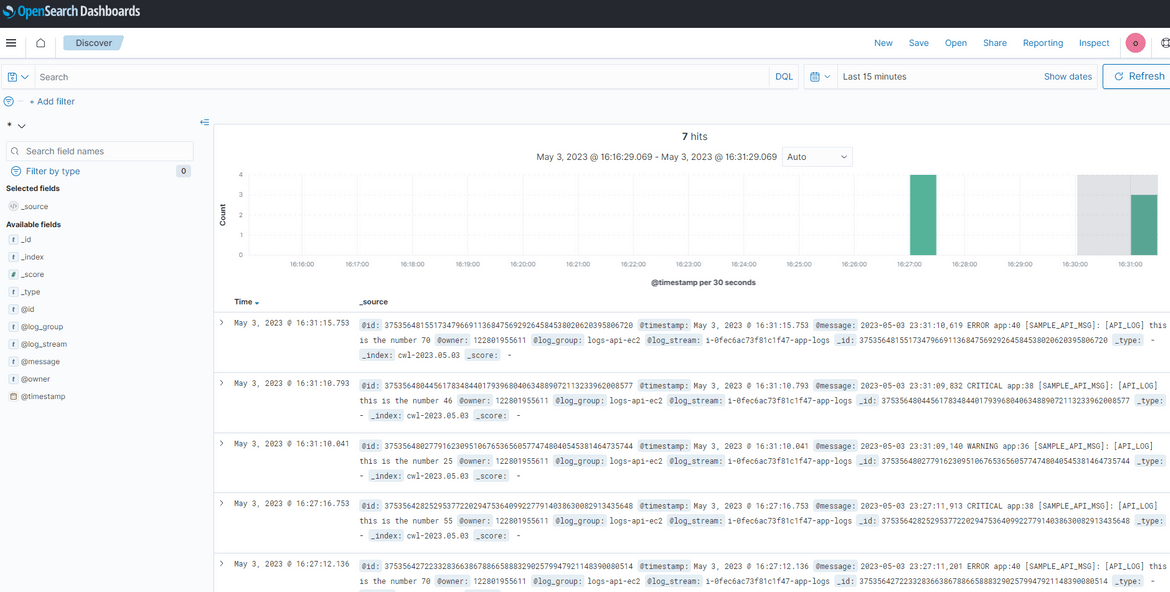
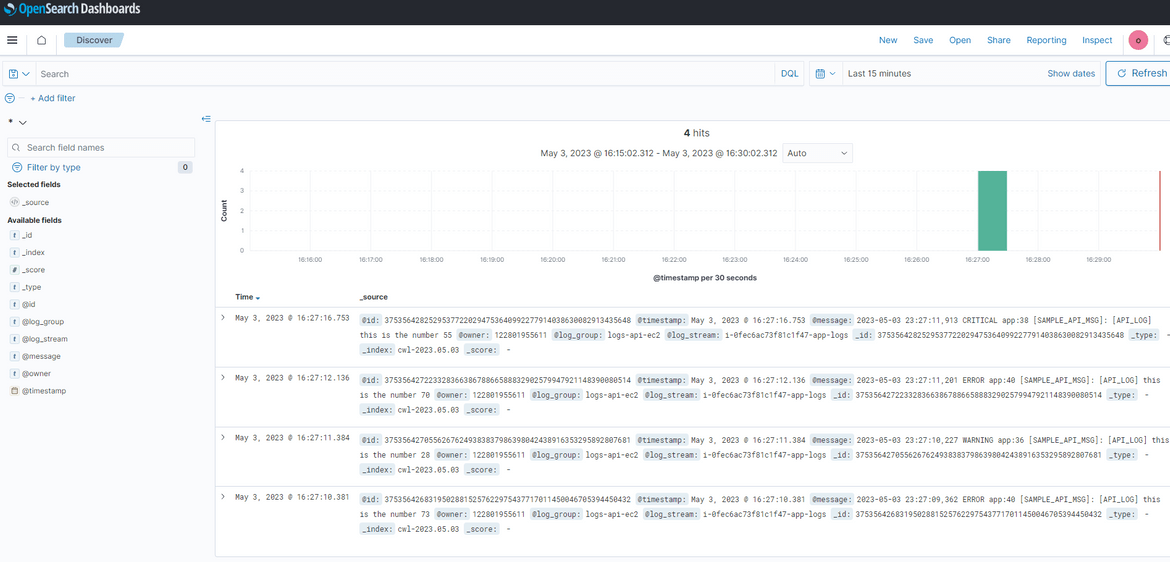
This will generate some logs which gets forwarded to the Cloudwatch log group. We can view the logs in the log group.
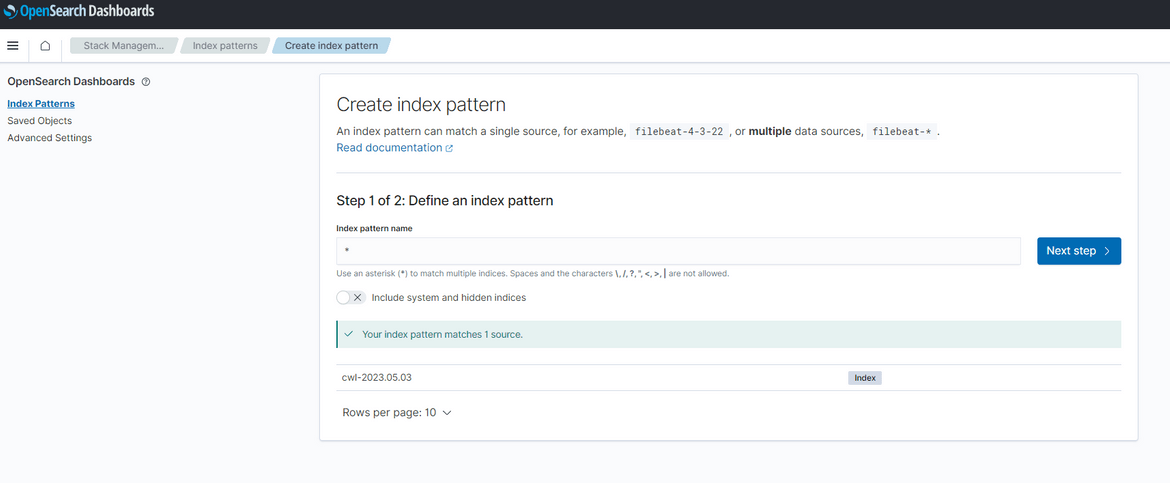
Now these logs would have already forwarded to the Opensearch cluster. Lets view the log rows in Opensearch. Login to the Opensearch dashboard as we did before. To view the log rows, first we will need to create an index pattern. Navigate to the Discover option from menu and click on create Index pattern. On the create page, here I am providing ’*’ as the pattern. But you can use any pattern based on your use case.
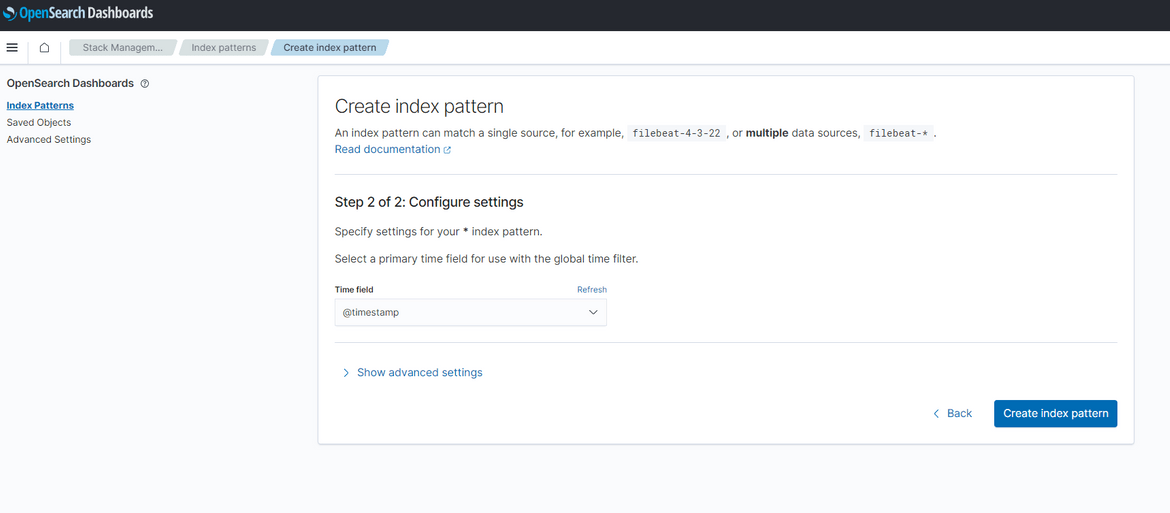
On next step, select the timestamp field as needed
Once done, click on Create button. This will create the index pattern. Now click on the Discover tab again and it should open up the page showing the log records sent from Cloudwatch.
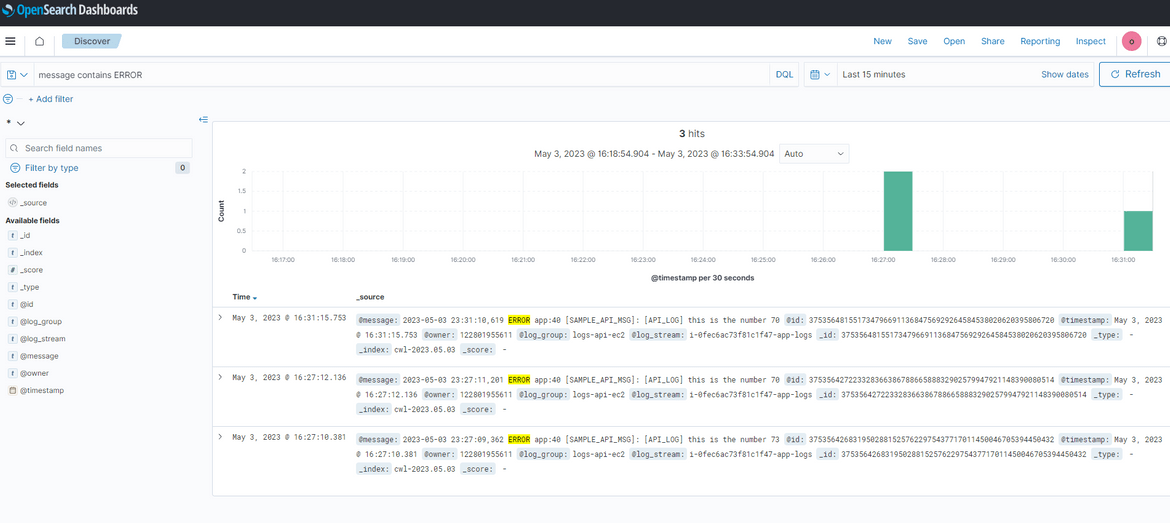
You can easily search on the logs to search for specific keywords. Here I am searching to show all logs which contain error keyword
So the whole stack for streaming logs to Opensearch is functional now.
Improvements
The process I showed here as example is a very basic process to get the logs to Opensearch. There can be many other complications added to the process based on use cases. Some of the changes I am working next on this are:
- Fully automate the deployment of the process
- Add a step to perform data modifications if needed for an use case
Conclusion
In conclusion, streaming logs from EC2 to CloudWatch and then to OpenSearch provides several benefits to organizations. By centralizing logs in a single location, you can easily monitor, search, and analyze logs from multiple sources. This makes it easier to identify and troubleshoot issues, track system and application performance, and meet compliance requirements. Hope I was able to explain this process in detail and it can help in your implementation or learning. If you have any questions or face any issues, please reach out to me from the Contact page.
