Deploy a resilient monitoring stack using Terraform and Ansible: Deploy Prometheus and Grafana clusters on AWS
Monitoring is a very important part of Devops for any application. Having a proper monitoring stack to monitor applications or measure performance is as important as deploying the application itself. So it becomes important for the team to maintain a resilient monitoring setup which is able to cope up with the application availability too. Thats why I started learning to deploy a HA (highly available) monitoring stack which can handle monitoring loads and stay HA.
In this post I am covering a resilient monitoring stack architecture which I created during my learning. The stack is deployed on EC2 instances on AWS and deployed using Terraform. The instances are configured using Ansible.
The GitHub repo for this post can be found Here. I am still updating some of the scripts to enhance the process so some files may be missing but overall you can go ahead and use the scripts to start your own cluster.
Pre Requisites
Before I start the walkthrough, there are some some pre-requisites which are good to have if you want to follow along or want to try this on your own:
- Basic Terraform, AWS knowledge
- Some knowledge about how Ansible works and how are the commands executed
- Github account or some GIT repo
- An AWS account.
- Terraform installed
- Terraform Cloud free account (Follow this Link)
With that out of the way, lets dive into the solution.
What am I building here
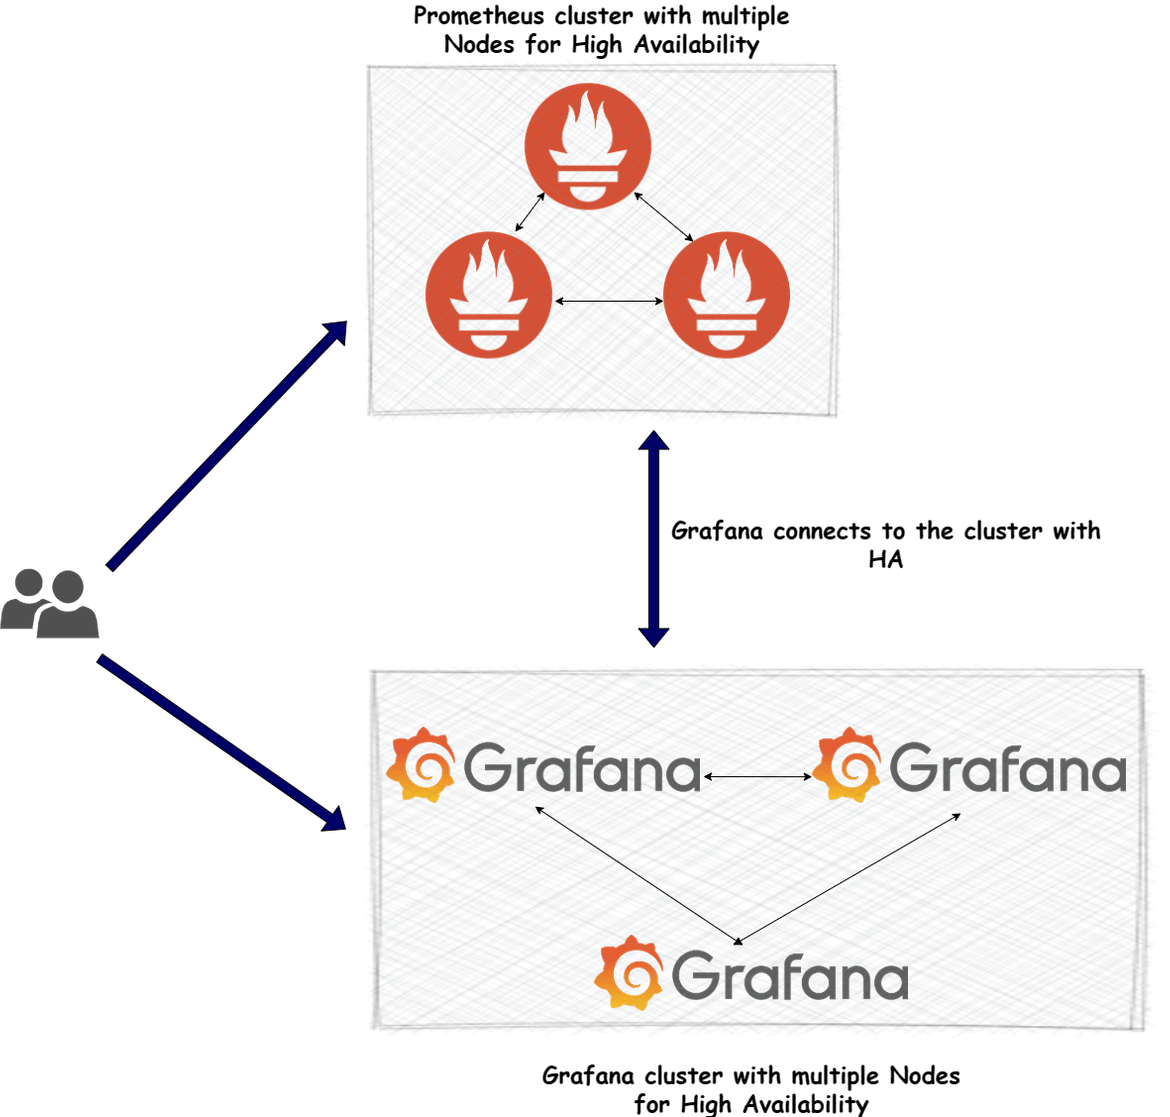
Let me first describe what this stack will do. The stack will provide a full monitoring stack using Prometheus for data scraping and Grafana for visualizations. Below diagram will show overall what the stack consists of.
Let me talk a bit about each of the above.
-
Highly Available Prometheus Cluster:
This consists of multiple nodes (servers) where each of the server is running a Prometheus instance. Since there are multiple instances, even if a node goes down, other nodes can handle the traffic. User accesses the Prometheus application with a single cluster endpoint which gets served by one of these instances. The data between the nodes gets synchronized so user doesn’t get to see redundant data on the console. Grafana connects to the Prometheus data source via the common cluster endpoint too so that the connection from Grafana to prometheus is also resilient.
-
Highly Available Grafana Cluster:
This consists of multiple nodes (servers) running Grafana instances. User accesses a cluster endpoint which gets served by one of the Grafana servers. This way even if a node gets down, other nodes are able to serve traffic. There is also a mechanism to sync the data between the nodes so users don’t see disconnected data when served by different nodes.
In this post I will describe how each of the cluster is achieved and deployed. This is what we will be using to deploy both of the clusters to AWS:
- EC2 instances for Prometheus cluster
- EC2 instances for Grafana cluster
- Networking for the cluster to enable communication and enable users to access the cluster
- Configure the EC2 instances to run the services
Tech architecture and details
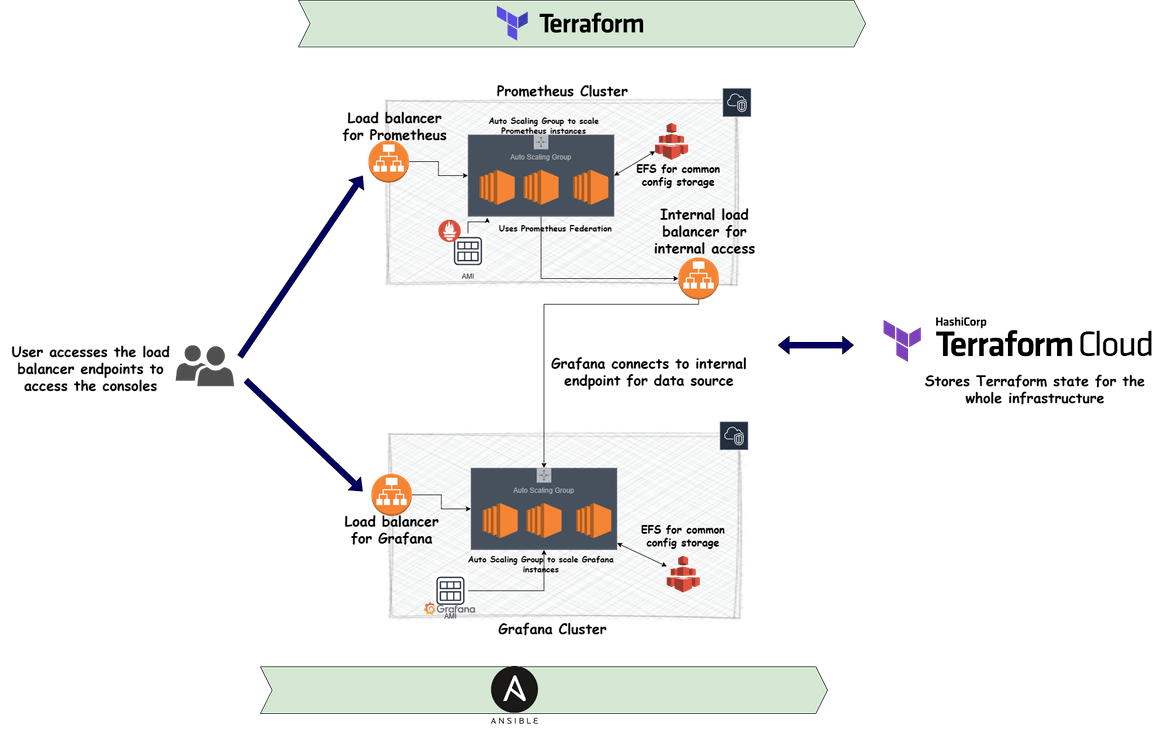
Let me first describe the technical architecture of the whole stack. Below image will show the whole technical architecture
Lets understand each of the component above
Prometheus Cluster components
- Load Balancer for Prometheus: This is the load balancer which will balance the traffic across multiple Prometheus nodes. This will make sure that the traffic flows to healthy instances. End user will be accessing this load balancer endpoint. The traffic wil be distributed across multiple nodes to have a resilient Prometheus cluster.
- Auto Scaling group for Prometheus instances: There will be scenarios when one or more Prometheus instances will fail. In those cases, we cant just have a cluster with less nodes. So the auto scaling group ensures there is always a desired number of Prometheus nodes (EC2 instances) running and service traffic to the load balancer. The scaling group will scale up and down based on load on the instances in the cluster. It will also ensure any failed instances are removed and replacement healthy instances are relaunched to maintain capacity.
- AMI for Prometheus: The auto scaling group launches new EC2 instances as part of the Prometheus cluster. It needs to have an AMI based on which the EC2 instances will be launched. This is a custom AMI created, which has Prometheus and other needed tools installed. The ASG uses this AMI to launch new instances as part of the Prometheus cluster serving traffic to the load balancer.
- EFS for Prometheus storage: Since there are multiple nodes involved in the cluster, which will be performing metrics scraping and serving read traffic, we will need a common storage for the nodes from where they will read the config files. An EFS file system is created and mounted on all the nodes so each node have a common config file for the Prometheus instances. Later I will cover how the config file is stored in the EFS. By the EFS mount, each EC2 instance and the Prometheus installation in them, is reading the same config file.
- Internal Load balancer for Prometheus: For end users to access the Prometheus instance, we have the load balancer endpoints. But for internal systems like Grafana, we don’t need the traffic to go through public network. So this internal load balancer is created which makes the cluster accessible for systems within the VPC. So Grafana can access the Prometheus data source using this private endpoint. Using this load balancer, instances can communicate using their private IPs. I will be covering this later, but one thing to note here is that, the Prometheus and Grafana EC2 instances are in a private VPC without any internet access. So this private load balancer endpoint makes the communication possible between these.
- Prometheus Federation: Since there are multiple instances of Prometheus which are scraping and serving traffic, we don’t want to provide inaccurate data to end users. Thats where Prometheus federation comes in which allows each of the instance to scrape metrics from each other and in a way dedup the data. This ensures end user sees accurate data and not redundant data. To learn more about Prometheus federation click Here
Grafana Cluster components
- Load Balancer for Grafana: Similar to the Prometheus load balancer, this also distributes the traffic to multiple Grafana installed EC2 instances. This ensures that even if one or more instances fail, the traffic will be redirected to the healthy instances. This provides and endpoint for the end user to access the Grafana dashboards.
- Auto scaling group for Grafana instances: This auto scaling group maintains a desired capacity of instances in the Grafana cluster. This ensures there is always a set number of nodes available and it scales up if there is load on the cluster or the instances. This will ensure there is always set instances serving traffic to the load balancer
- AMI for Grafana: The auto scaling group above uses this AMI to launch the instances. This AMI is created with Grafana and other needed tools installed. I will cover later about how the AMI is created
- EFS for Grafana storage: Similar to Prometheus, this EFS is created to store common config and settings files for Grafana. Each Grafana EC2 instance mounts the EFS and the Grafana instance reads the setting files from the common shared file system. This ensured each Grafana node reads the same settings. The file share also ensures each Grafana instance writes the saved settings like data sources, dashboards etc in a common location. This way each node reads the same data and provides the same data to end user. Any new instance launched by the Auto scaling group also reads the same data from EFS and provides uniform data to the user. This ensures a data sync between the Grafana nodes in the cluster.
Terraform and Ansible usage
All of the components which I described above are launched in AWS using Terraform. There are Terraform scripts created for all of the components and all supporting components like networking ans security(IAM). Using Terraform all of this infrastructure is deployed to AWS. The Terraform state for the whole infrastructure is stored in terraform cloud. I am using Terraform cloud as the backend for all Terraform deployments in this. I will cover later, how to setup your own Terraform cloud.
For configuring the EC2 instances to run Prometheus and Grafana, I am using Ansible. Below are the tasks which are being handled using Ansible:
- Configuring and bootstrapping initial temporary instances to create the AMIs for Grafana and Prometheus
- Bootstrapping the instances launched by the auto scaling groups for Grafana and Prometheus clusters. On launch of the instances, Ansible scripts run to configure the EC2 instance
All of the components above are part of an AWS VPC. The networking components (described below) allow the communication between the components. End user accesses the application using the load balancer endpoints. A route 53 hosted zone can be created to provide a domain through which they can be accessed.
That should give an idea of all the components involved. Lets move to understanding the components in depth.
Tech details for the components
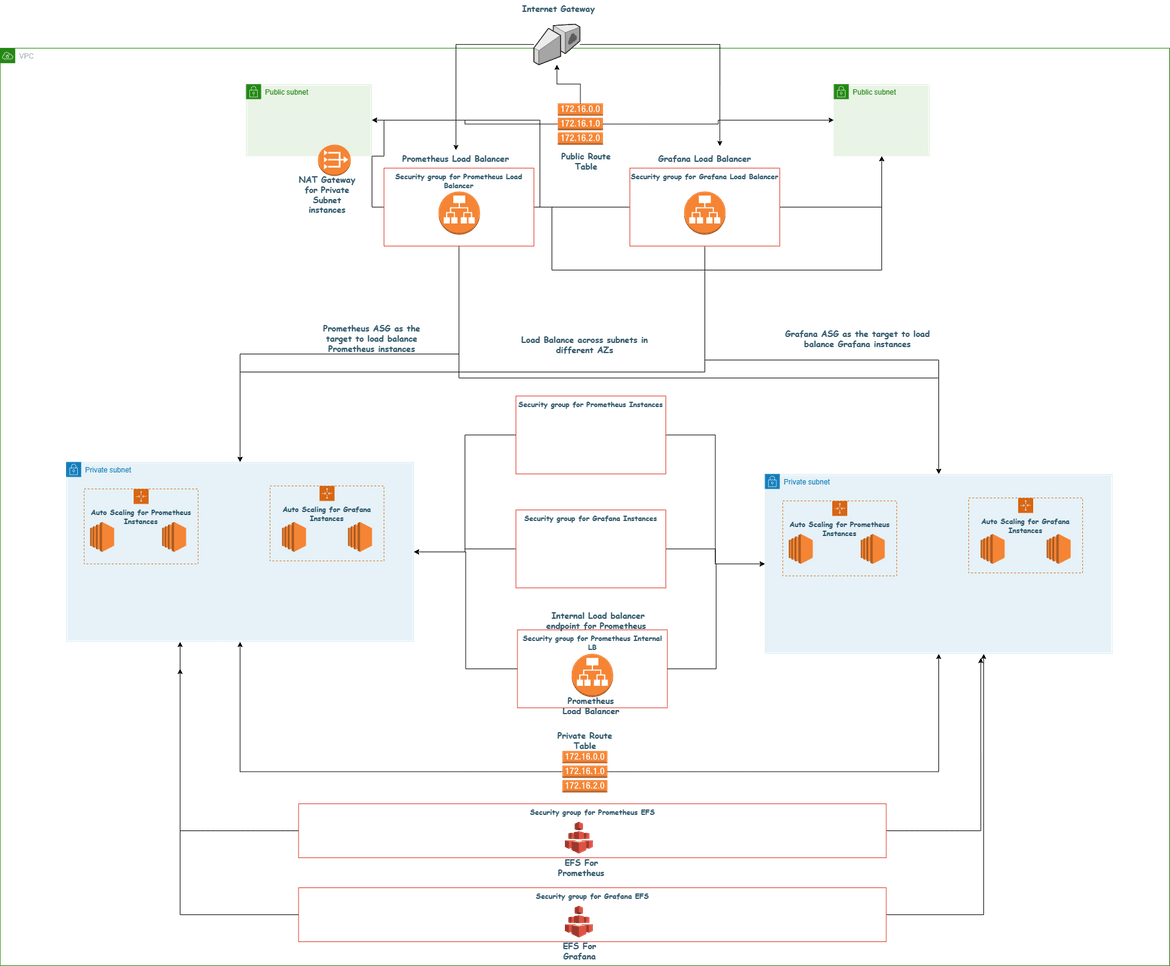
First lets see what are the components which are deployed to AWS for this. Below diagram shows all of the parts of the whole architecture which will be deployed to AWS.
Lets go through the components following each module. The infrastructure is divided into different Terraform modules. Here are the modules:
-
Networking: All of the networking components are defined in the Networking module in Terraform. It can be found in the infrastructure folder in my repo. These are the components which are created in this module:
- VPC: There is one VPC which encompasses all of the infrastructure. This VPC is deployed in a region (us-east-1).
- Internet Gateway: An IGW is deployed for the public subnets and internet reachability for the public endpoints
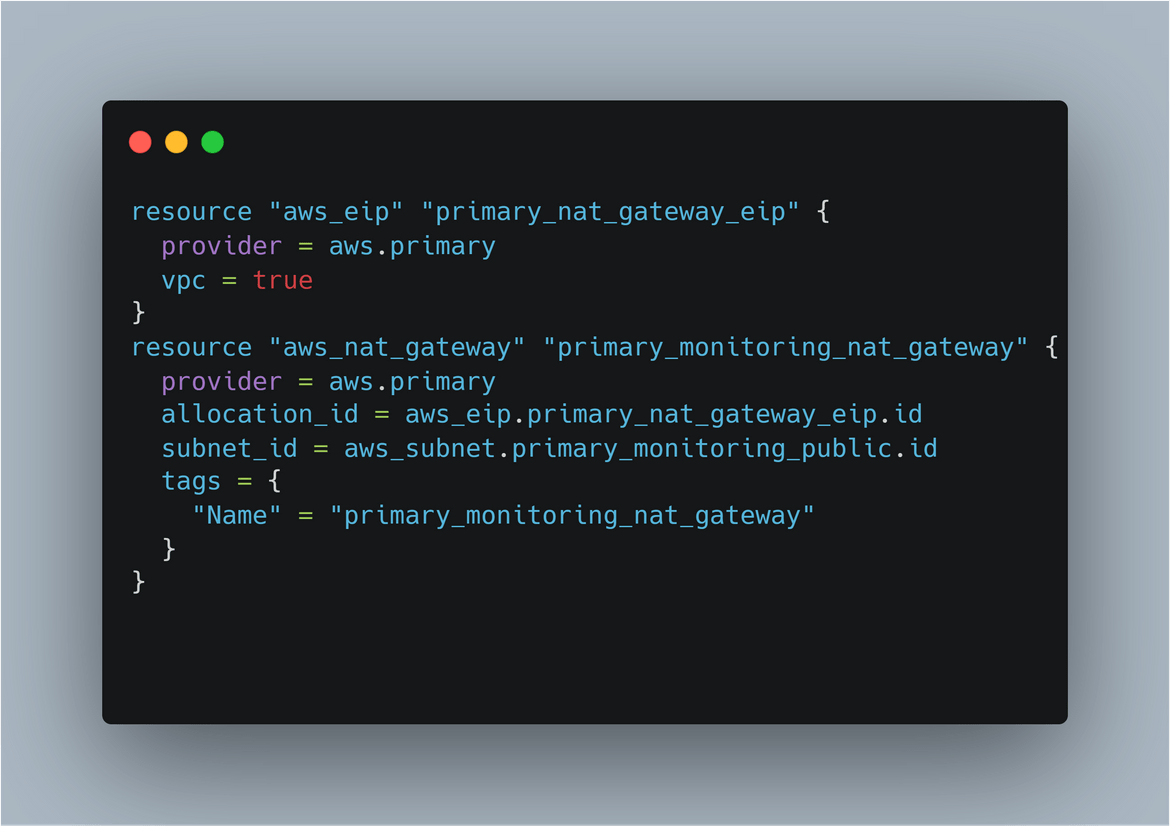
- NAT Gateway: A NAT Gateway is deployed for instances in the private subnets to be able to reach internet to get updates. It is deployed in the public subnet
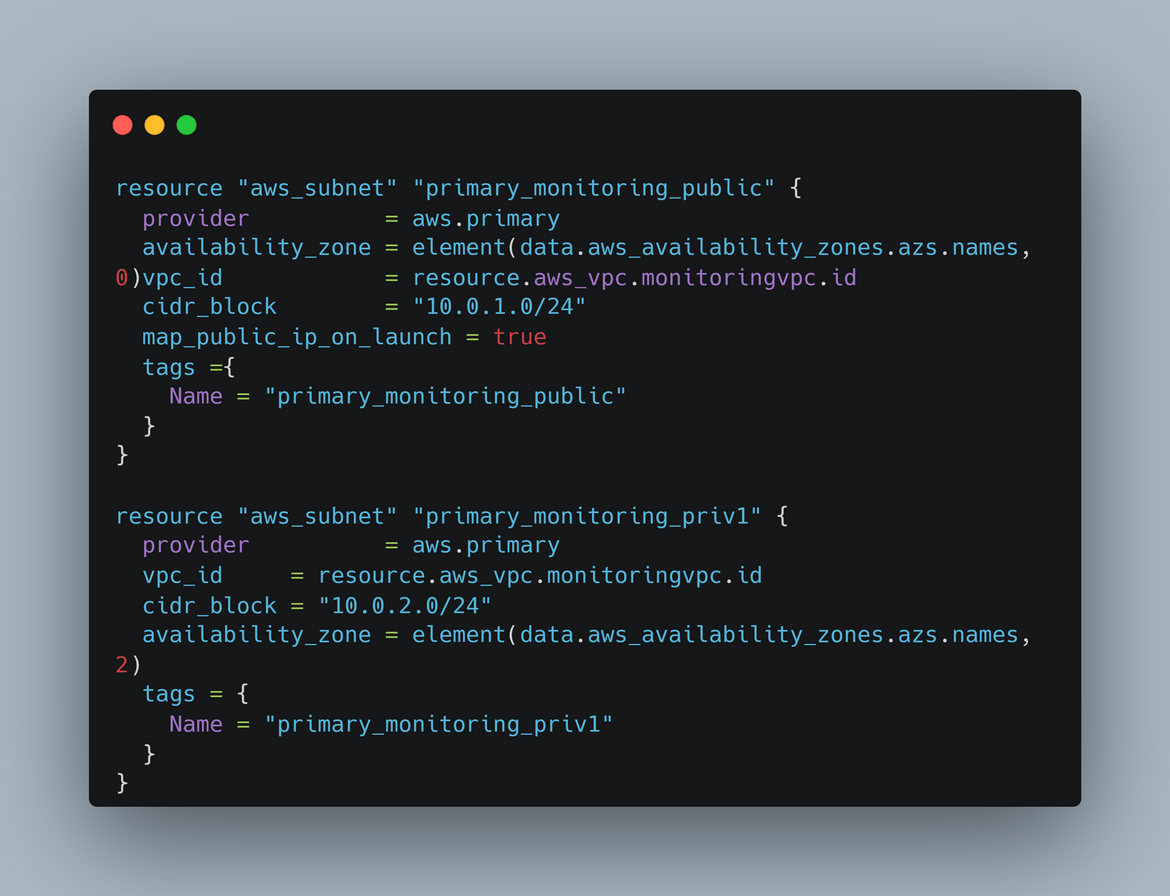
- Subnets: There are 4 subnets created here. Each subnet is in a different AZ to have HA on the load balancers. There are 2 public subnets and 2 private subnets. The private subnets house all of the instances
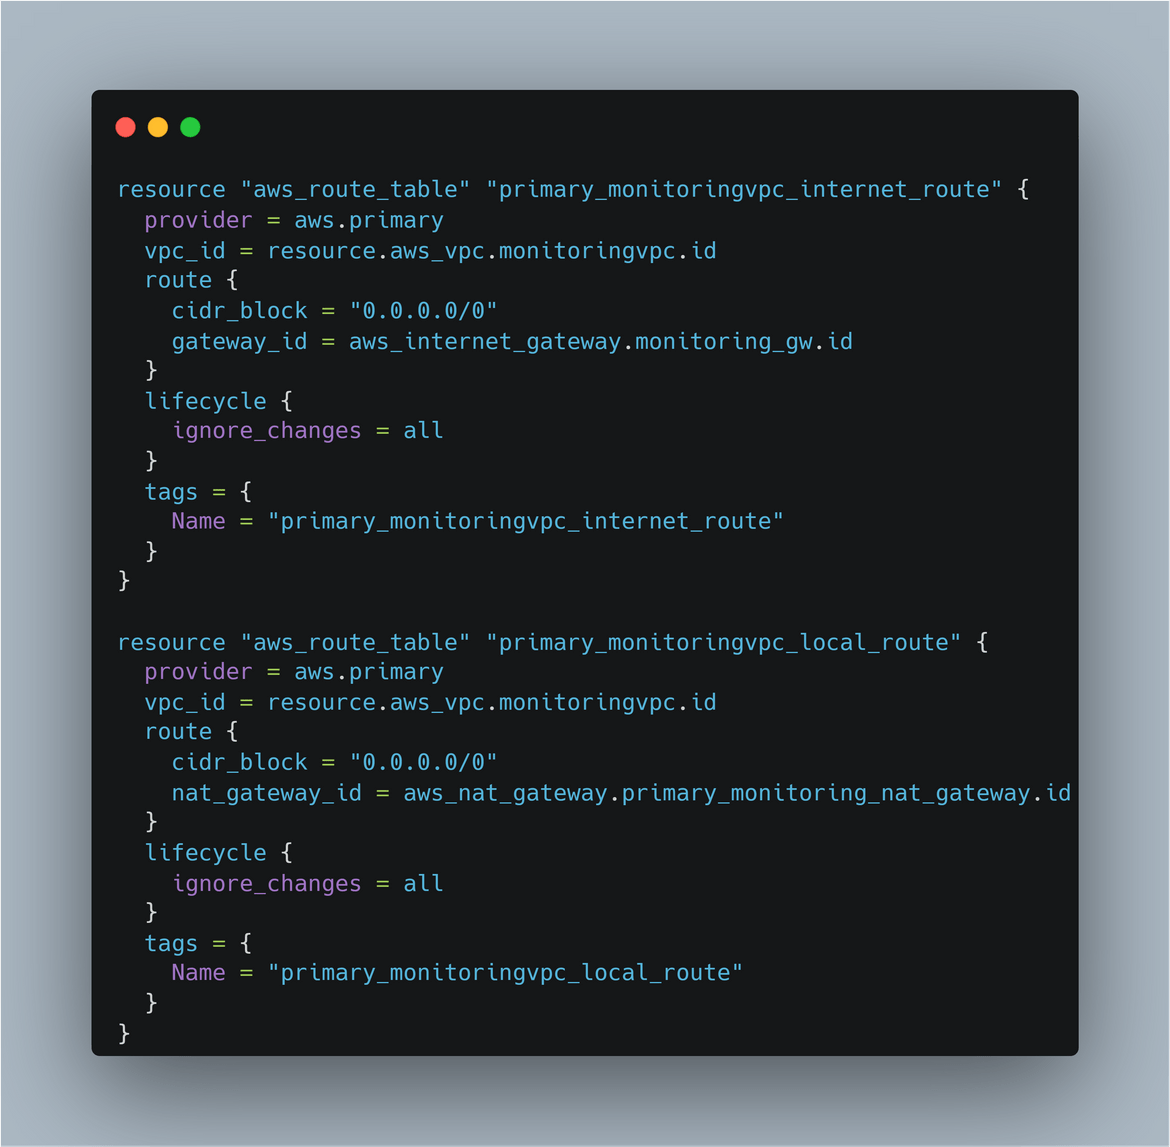
- Route Tables: There are two route tables created. One of them is to to define the route to the internet for public internet accessibility in the subnets. Other one is the private route table for local routes and for the route from the private subnet to the NAT gateway.
- Security Groups: There are various security groups created for each of th above component to secure the traffic.
Those are all the networking components defined in the Networking Terraform module.
-
Instances: This module defines all the infrastructure needed to run the instances and access the instances. These are the components in this module:
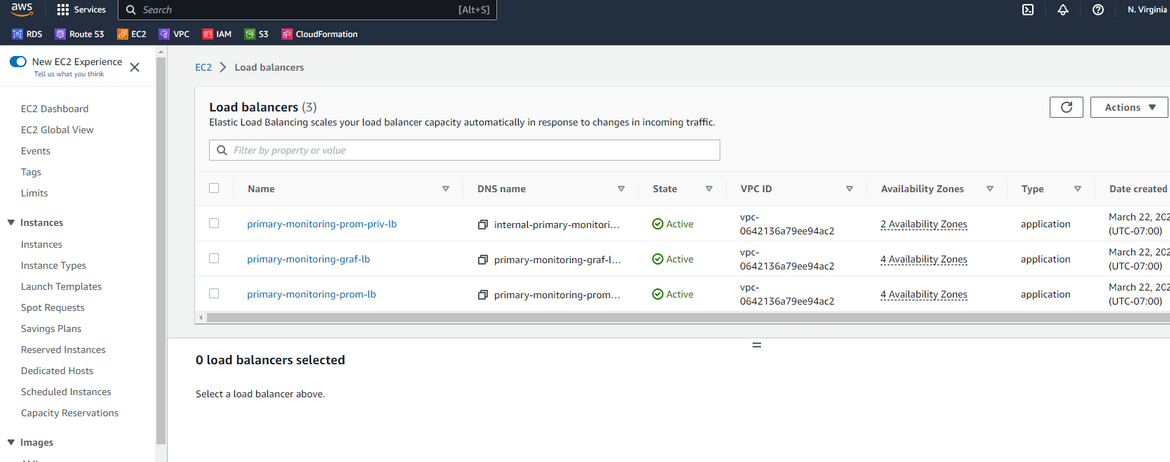
- Load Balancers: There are two load balancers created. One is to serve the traffic for Prometheus instances and other one is for the Grafana instances. Though not show in the diagram, there are also other elements deployed to make the LB work like target groups, listeners etc. The target group is pointed to the Auto scaling group so the load balancer serves traffic from the auto scaling group. The load balancer is configured to load balance across AZs and multiple subnets to have HA.
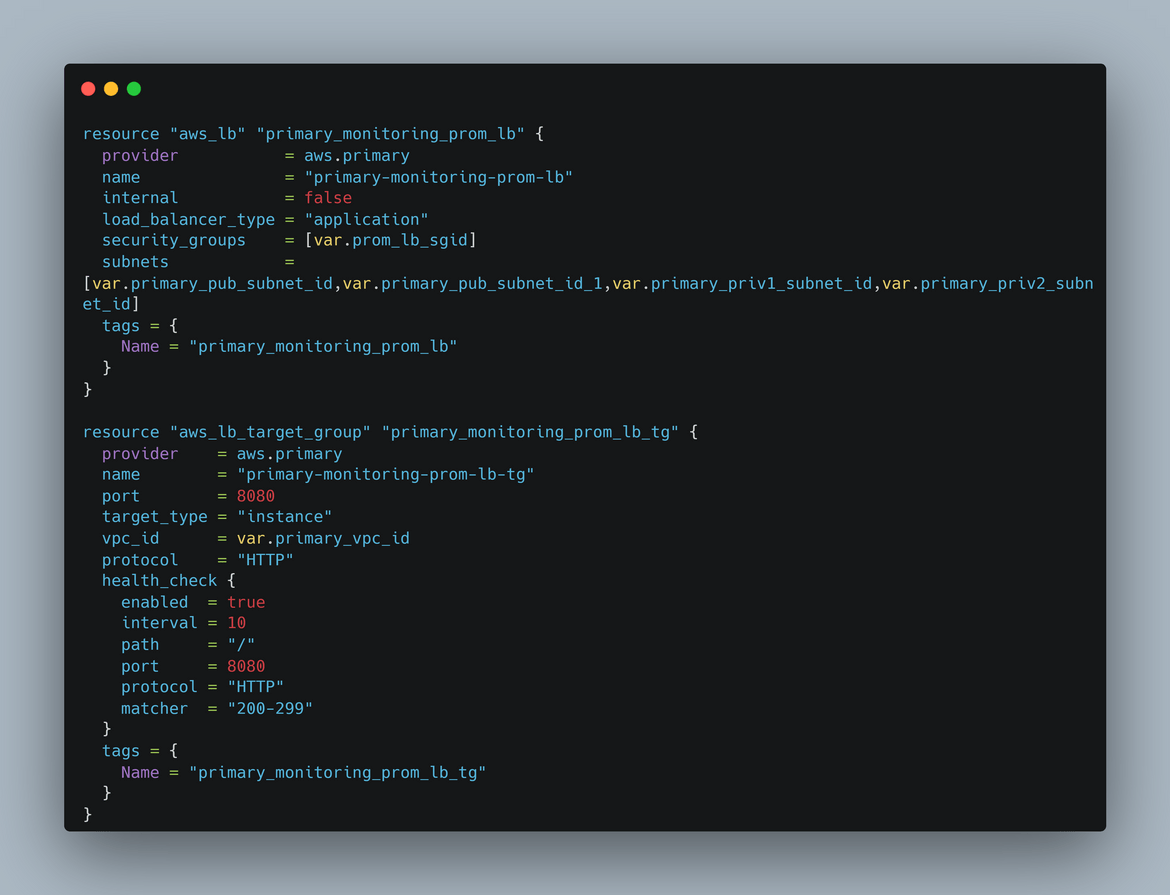
- Internal Load balancer: There is an internal load balancer created to expose the Prometheus instances to intra network traffic. Grafana can reach this internal LB endpoint to get the Prometheus as data source.
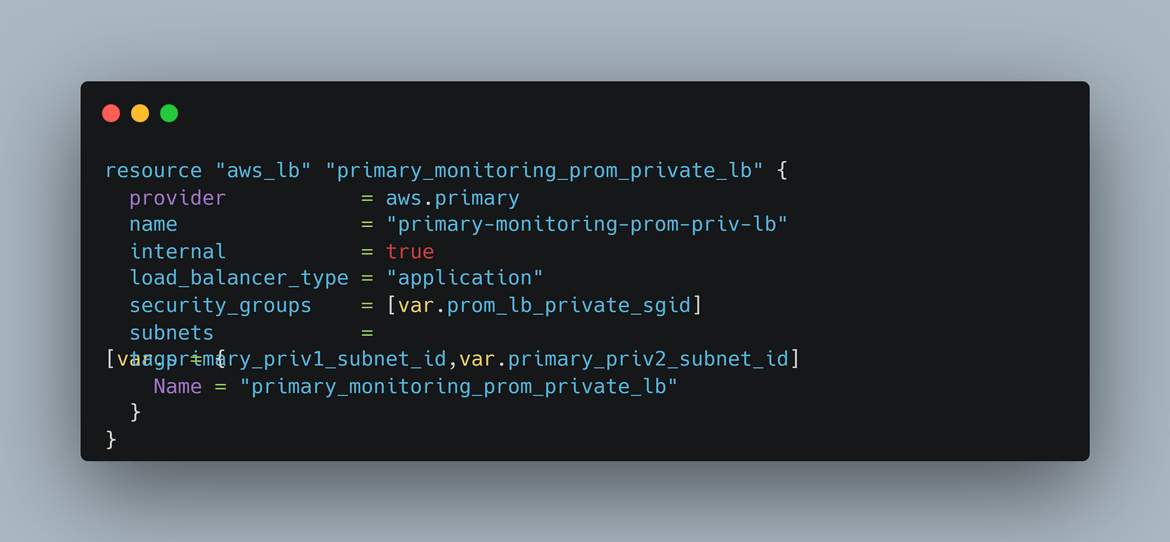
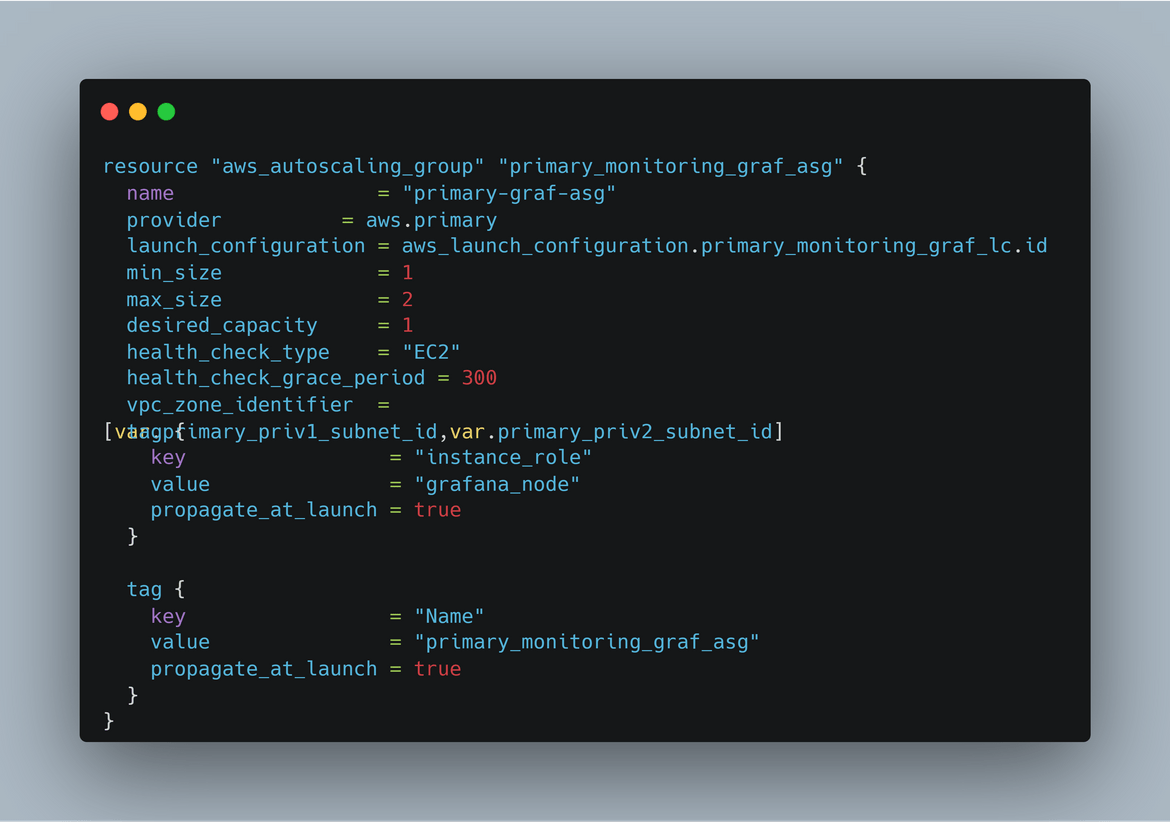
- Auto Scaling Groups: There are two auto scaling groups created. One of them launches and scales the Prometheus instances, other one is for the Grafana instances. They both launch instances across multiple subnets and AZs. This enables the load balancers to load balance across AZs and make the setup highly available.
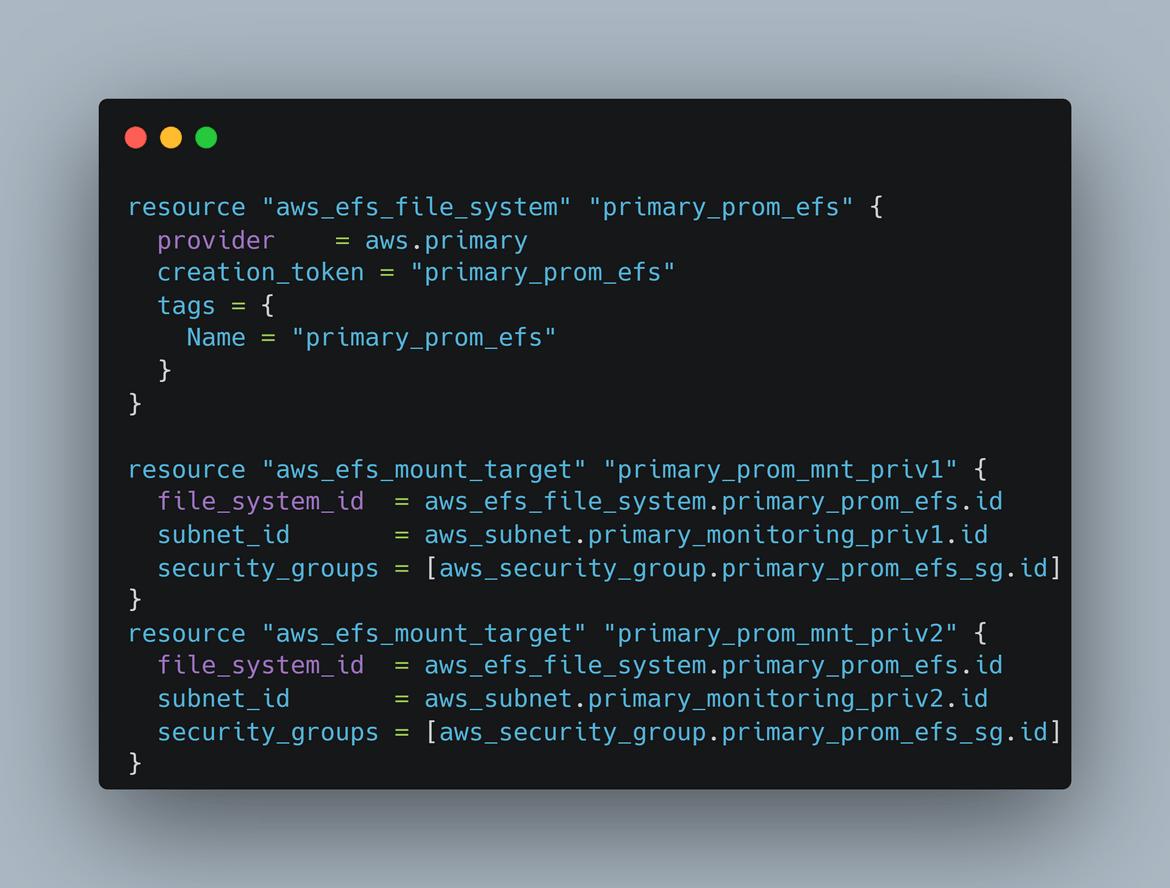
- EFS File systems: There are two EFS file systems crated. One is to store the config files for Prometheus and shared by all the Prometheus instances. Other one is to store the config and other files for Grafana which are shared between the instances. To mount the EFS, there are different mount targets created for each subnet
Those are all the components related to Instance infrastructure.
- Load Balancers: There are two load balancers created. One is to serve the traffic for Prometheus instances and other one is for the Grafana instances. Though not show in the diagram, there are also other elements deployed to make the LB work like target groups, listeners etc. The target group is pointed to the Auto scaling group so the load balancer serves traffic from the auto scaling group. The load balancer is configured to load balance across AZs and multiple subnets to have HA.
- Security: This module deploys everything related to IAM. There are different IAM roles created which are used by the instances to access AWS services like S3. These IAM related components are defined in the security module.
Those are all the components involved in this whole architecture. These components are deployed to AWS using Terraform. A main Terraform script calls all of these modules and performs the deployment. Now we will move on to other parts of the stack provisioning.
AMI create architecture
To create the initial AMIs for Prometheus and Grafana, I am launching a temporary instance tp install needed tools and then create the AMI from it. Below is the simple stack I am launching for this temporary AMI instance (thats what I am calling it).
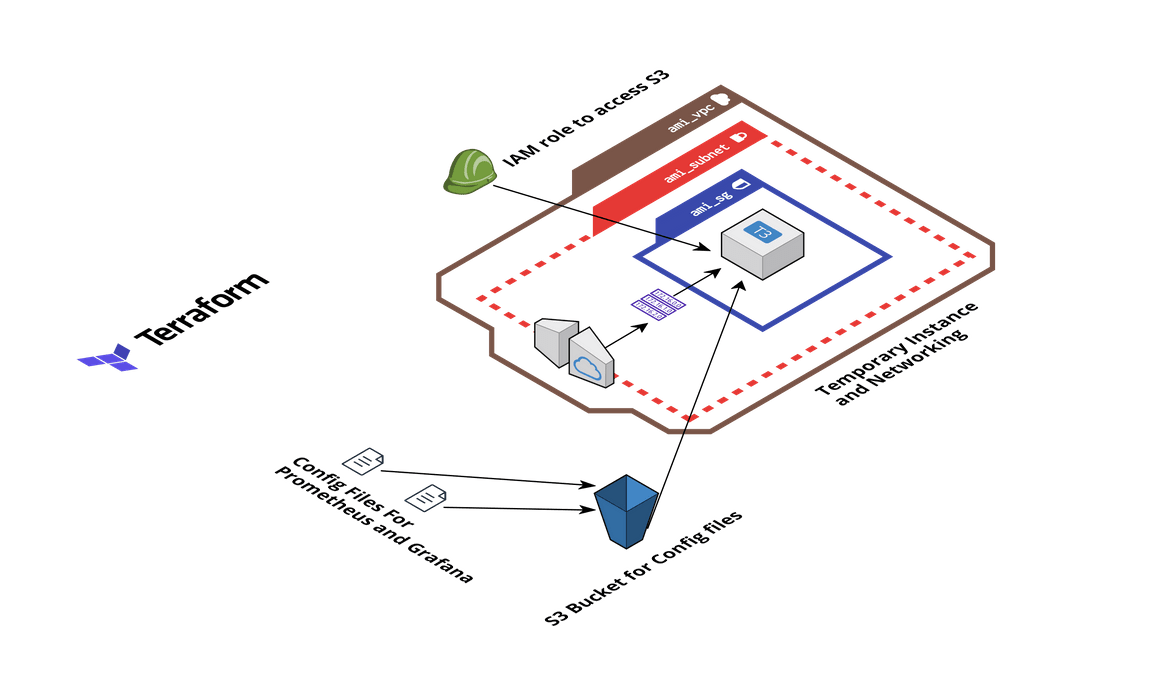
- EC2 Instance and Networking: A temporary instance is launched. This instance is used to install all the necessary tools and packages. Once installed, an AMI is created is created from the instance. This AMI is used by the auto scaling groups. Two instances are launched one after another, one for Prometheus and one for Grafana. The networking is launched to be able to connect to the instance and install the packages. The packages are not installed manually. Ansible playbooks are executed to install all needed packages on the instance.
- S3 Bucket and Config files: After installing the packages on the EC2 instances, the Prometheus and Grafana instances need to be configured on those instances. They need their own config files for some default settings. These config files are stored in an S3 bucket. The EC2 instance pulls the config files from the S3 bucket and configures the Prometheus and Grafana instances. This step is handled in the Ansible playbook itself. So I am deploying an S3 bucket and uploading the config files in the bucket.
- IAM Role for EC2 Instance: For the EC2 instance to be able to pull the config files, an IAM role is created. This role provides permission to the EC2 instance, for the S3 bucket.
This whole architecture is deployed using Terraform. I have included the Terraform module in the repo.
Ansible details
Now lets understand the Ansible playbooks involved in the process. There are different playbooks for each of the instances. The playbooks are in the folder ansible_playbooks. Lets go through each.
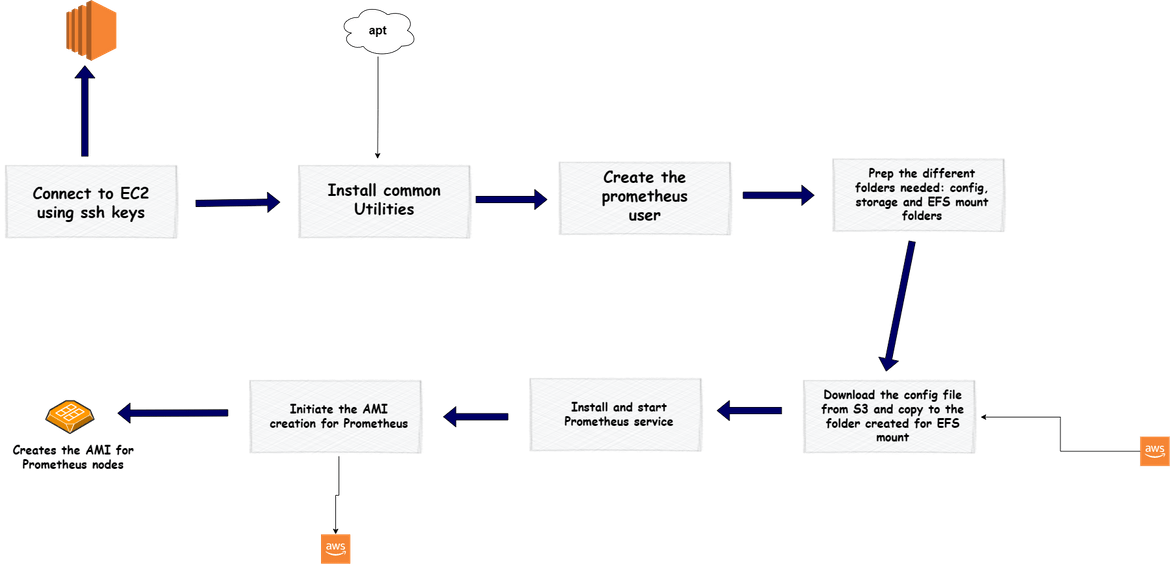
- prom central: This playbook is used to bootstrap the temporary instance which is launched to create the AMI. This playbook runs on the temporary instance and configures a Prometheus instance on the EC2 instance. Below image shows the flow of this playbook
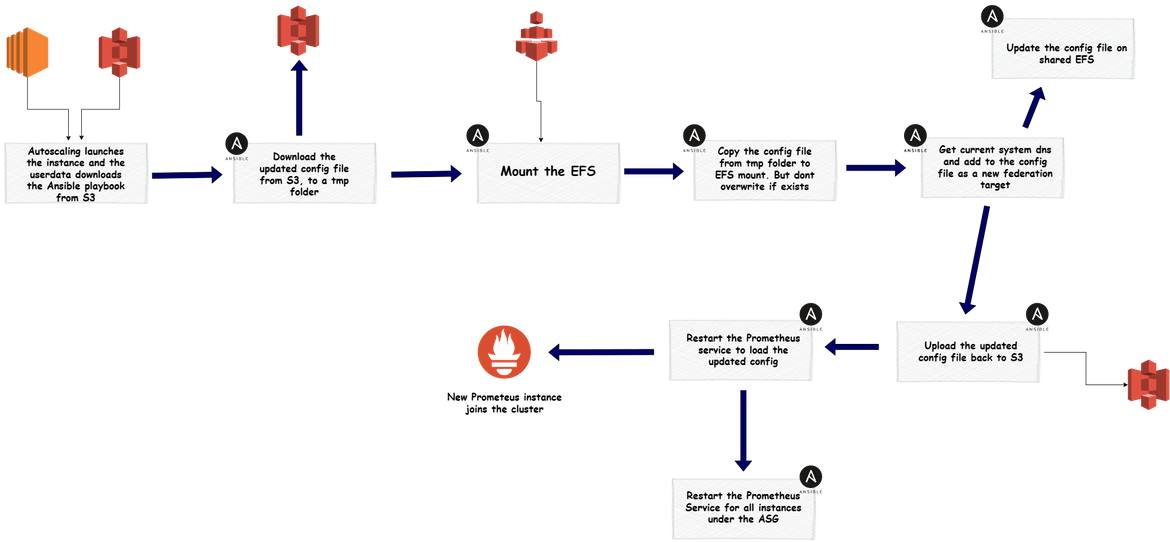
- prom autocaling: After the AMI is created, that AMI is used by the auto scaling group to launch new Prometheus nodes which join the cluster. But once the ASG launches, to make the new instance available in the cluster, there are few steps to be executed on the instance. These are executed using another Ansible playbook. Lets see the flow for this
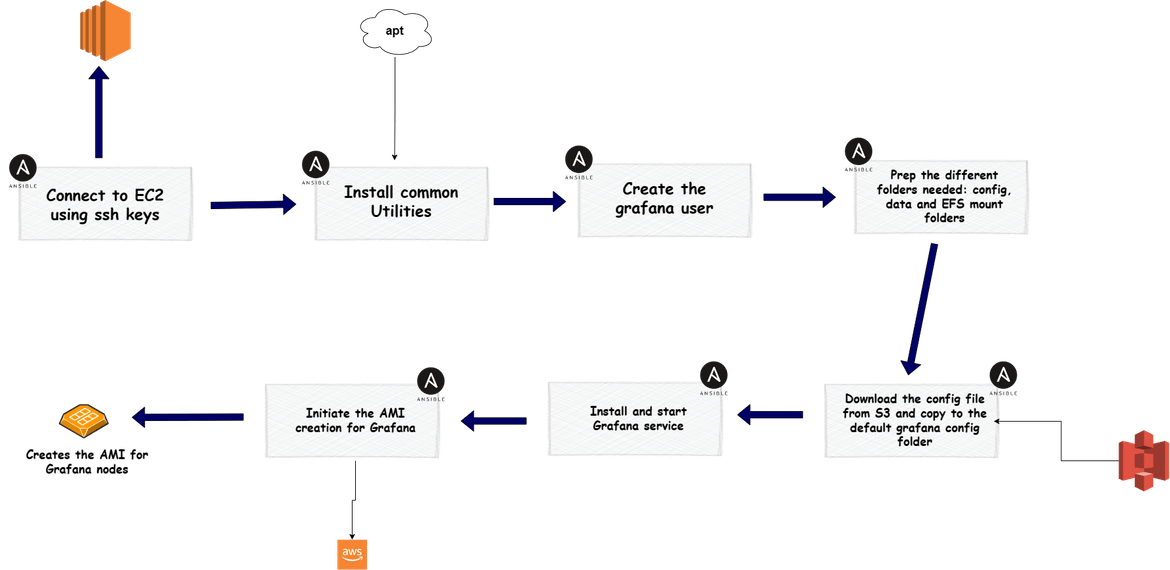
- grafana main: Similar to Prometheus, this playbook bootstraps the instance for creating Grafana AMI. The EC2 instance launched to create the Grafana AMI, is used to execute this playbook.
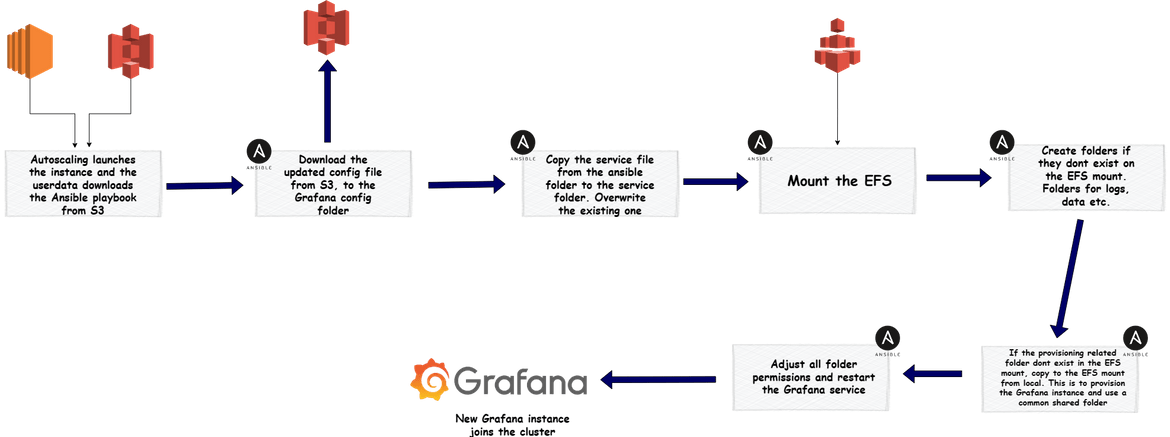
- grafana autoscaling: For the instances launched by the auto scaling group for Grafana cluster, they need to be bootstrapped so they can work together with the other Grafana nodes. An ansible playbook runs on the instances once they are launched by the auto scaling group. Below is the flow for the playbook.
All of these Ansible playbooks are in the repository. We will use all of these to launch these clusters next.
Deploy the stack
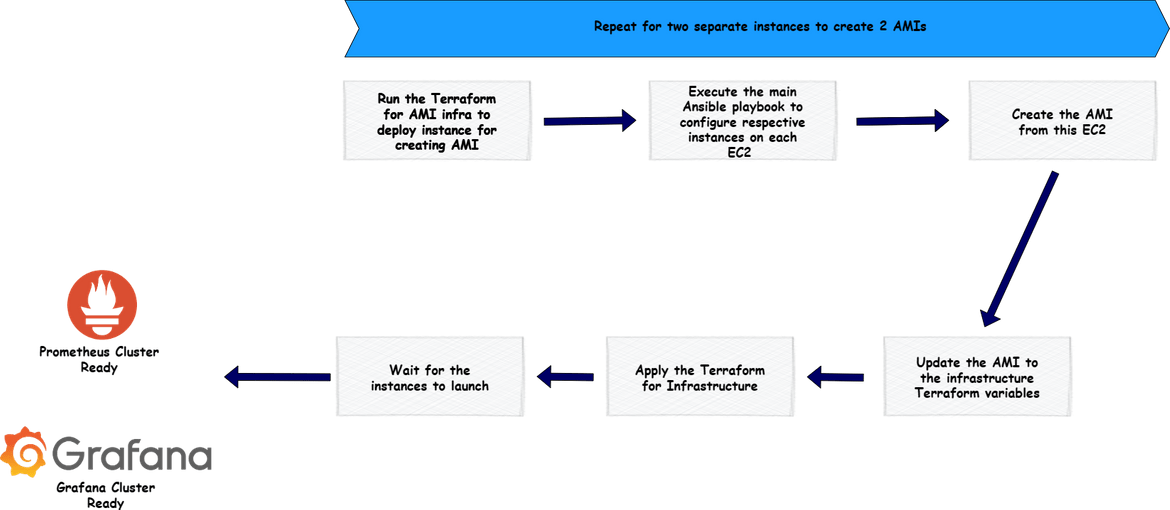
Now that we have an understanding of the components, lets deploy the stack to AWS. Below is a high level flow of steps to deploy the whole stack. Lets deploy each one by one.
Folder Structure
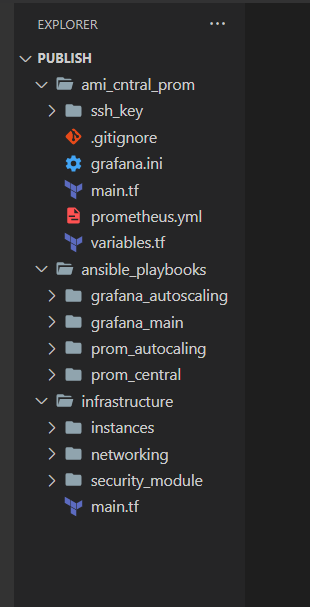
Let me explain my repository folder structure, if you are following along. You can follow any structure of your own.
- ami central prom: This folder contains the Terraform module to deploy the temporary instance for the AMI creation.
- ansible playbooks: This folder contains all of the Ansible playbooks. Different folder contain different playbooks as I explained above.
- infrastructure: This folder contains all of the Terraform modules to deploy the whole infrastructure for the stack. Contains submodules in separate folders.
Terraform Cloud Setup
I am using different Terraform modules for the Infrastructure as code. Terraform manages its state to track the resources. The state can have different types of storage like local folder, S3 bucket etc. Here I am using Terraform cloud to manage the Terraform state. I setup a free account on terraform cloud and then using that to deploy the modules. For more details on setting up and using Terraform cloud, I have created a Youtube video which you can view Here.
Generate ssh keys
The EC2 instances which we are deploying here, for Ansible to connect to those instances, we will need ssh keys generated. Now this is not a best practice which I am doing here and ssh keys have to be stored in secure place from where it has to be fetched. But for this example I am generating the keys and keeping in the folders. If you already have a way to keep them secure and read from there, go ahead and implement that. Run this command to generate a ssh key pair
ssh-keygen -t ed25519 -C "your@email.com"Once the keys are generated, keep the keys in the folders. If you are using my repository:
- Keep the private key (id rsa) file in the ansible playbook folders. I have placed empty ssh_key folders in the repo where the keys need to be placed
- Keep the public key in the terraform folders. I have placed the empty folders in them too
Ansible Playbooks to S3 Bucket
For the instances launched by auto scaling to run the Ansible playbooks, it has to download the playbooks from an S3 bucket. These are the playbooks which needs to be uploaded to an S3 bucket:
- grafana_autoscaling
- prom_autoscaling
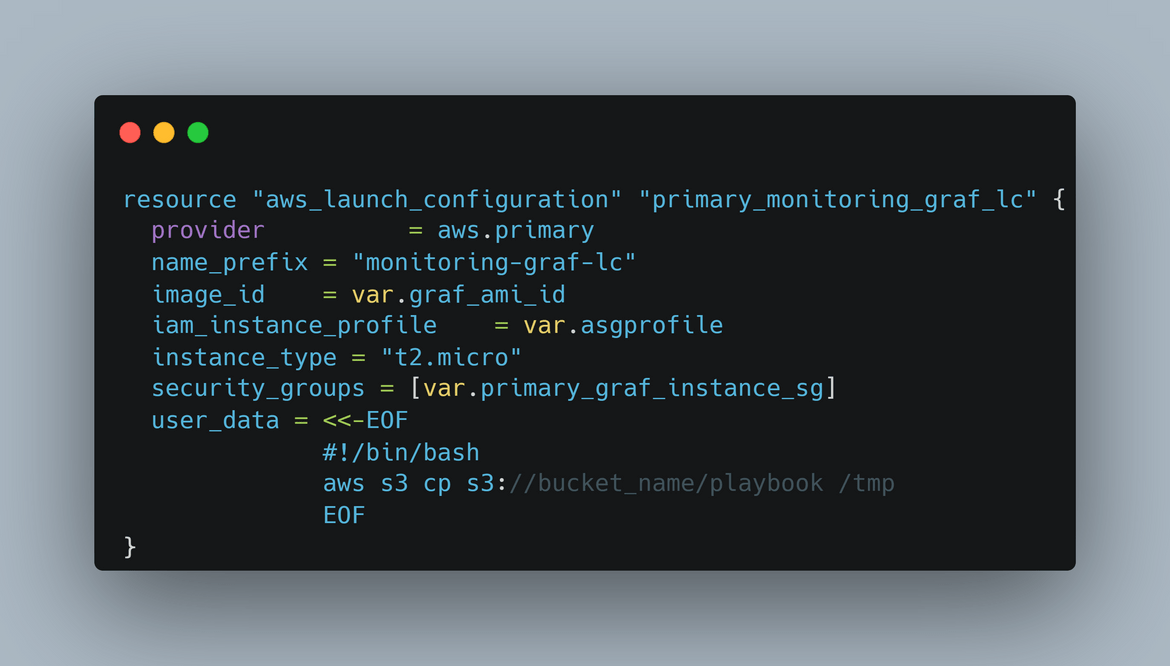
Once uploaded, the auto scaling group launch configuration userdata needs to be updated with the step to download the playbook from S3
Deploy both Clusters
Below flow shows high level steps to deploy the AMI Infrastructure and create the AMIs.
Lets deploy this cluster. To start the deployment, if you are following along, clone my repository and place the ssh keys in specific folders as I mentioned above. Before we start the deployment some pre requisites which you have to setup are:
- Setup a Terraform Cloud project which will handle the Terraform deployments
- Generate AWS Access keys for AWS credentials and update on the Terraform cloud project so it is able to deploy to AWS
- Login to Terraform cloud from local CLI to perform deployments. For steps pleas refer tp the video link above
- Placed the ssh keys in respective folders and pushed to the S3 bucket and repo
Create AMI for Prometheus
First we will create the AMI infrastructure to create the AMI. Apply the Terraform module in the ami central prom folder. This will launch all of the components and an EC2 instance.
cd ami_central_prom
terraform apply --auto-approve
This will start a run on terraform cloud to deploy the infra.
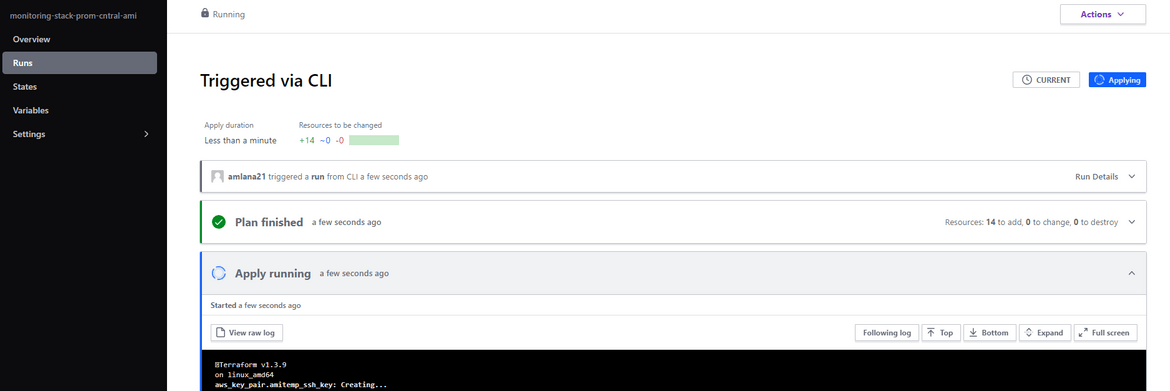
Once it finishes, it will create all of the networking and he EC2 instance. Copy the public IP for this instance as we need it later.
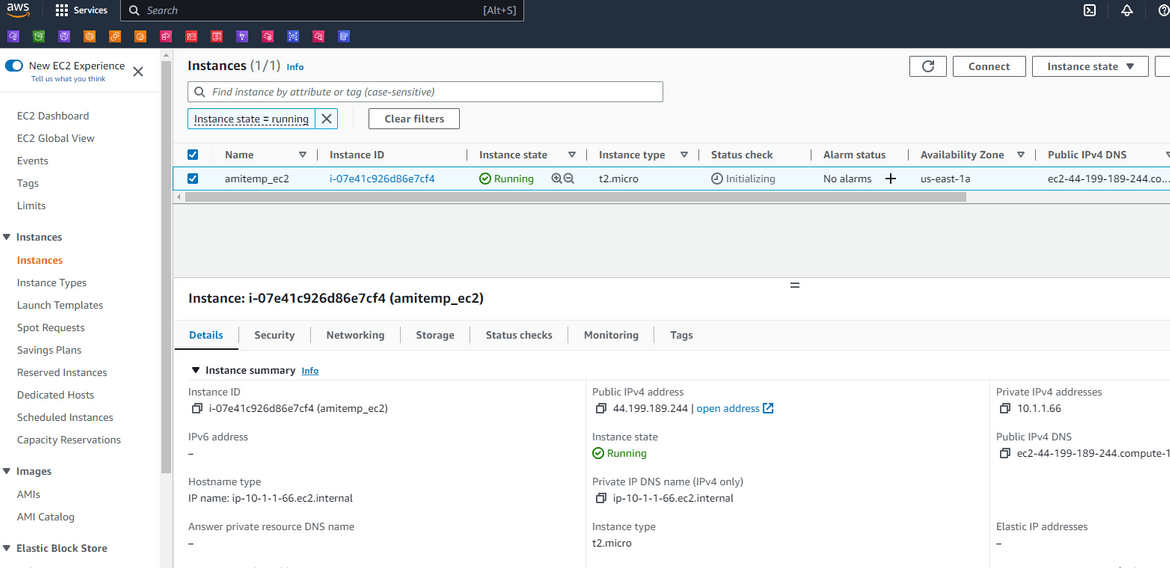
Copy the public IP and navigate rto the ansibleplaybooks/promcentral folder. Update the IP in the inventory file (inv)
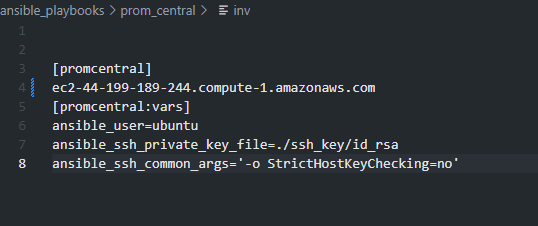
Once IP is updated, we are ready to bootstrap the instance. Run the ansible playbook in the same folder to start the bootstrapping for the instance.cd ansible_playbooks/prom_central/ ansible-playbook main.yml -i invThis will start the bootstrapping of the instances
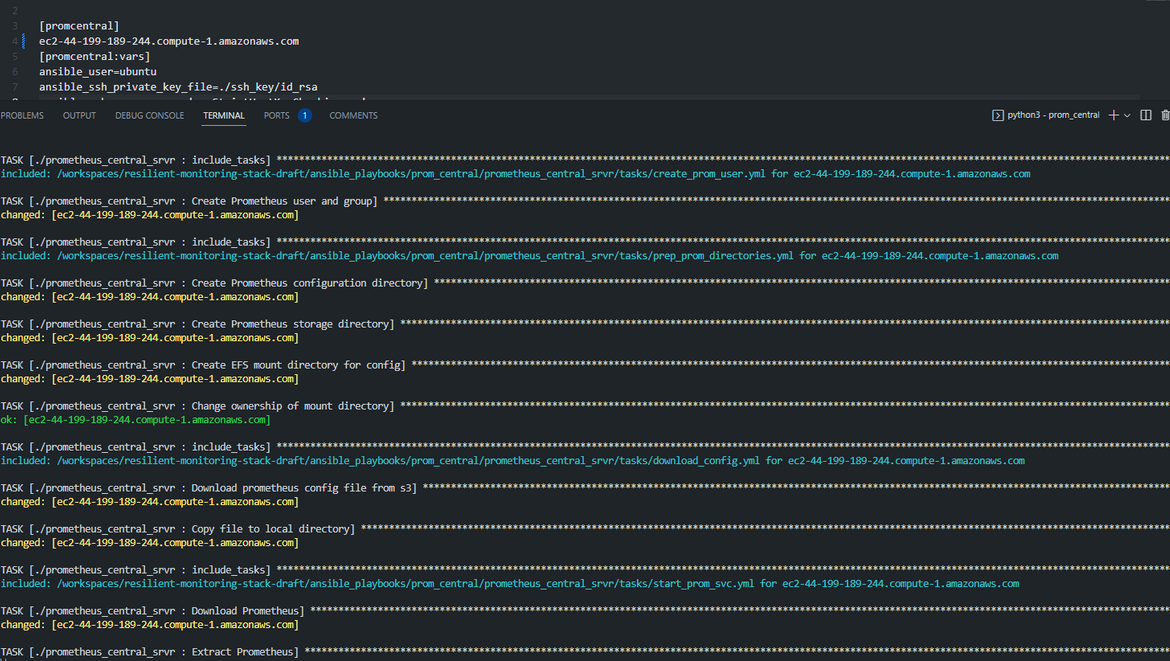
Once it completes, it starts the creation of AMI which can be checked on AWS. It will take a while to complete
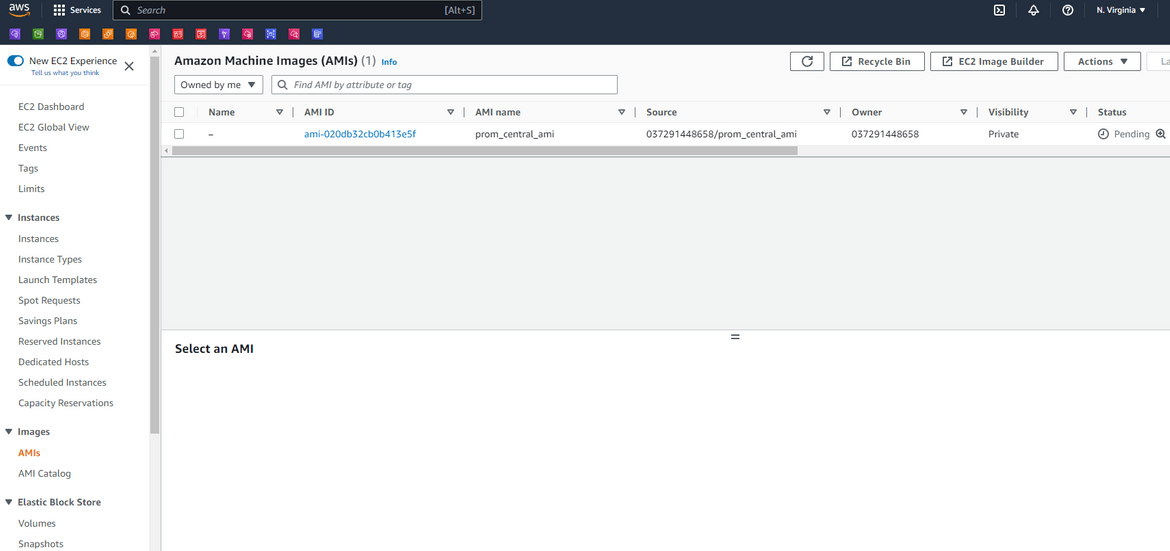
Copy the AMI ID and update the AMI ID on the variables file for instances Terraform module
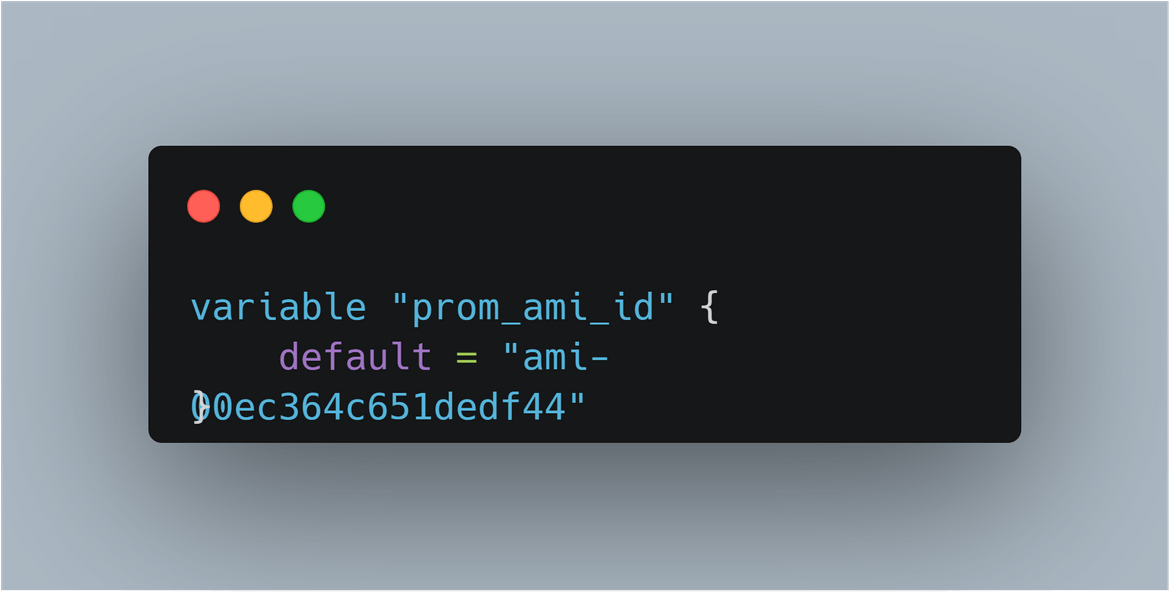
Now you have the AMI for Prometheus
Create AMI for Grafana
To create the AMI for Grafana, we will need a new EC2 instance. Lets delete the instance created for Prometheus AMI (after the AMI creation completes). Once the EC2 is deleted, run the Terraform apply again in the ami central prom folder to create a new EC2 instance
cd ami_central_prom
terraform init
terraform apply --auto-approve
This will trigger a new run on Terraform cloud and create the new instance. Copy the public IP or DNS for this new instance and copy it in the inventory file for the ansible playbook in ansibleplaybooks/grafanamain
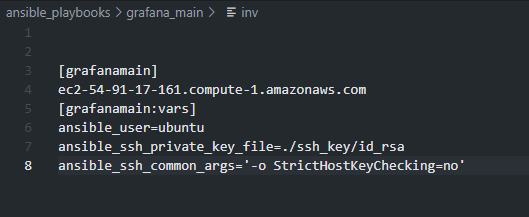
Once done, run the ansible command to run the playbook for Grafana instancecd ansible_playbooks/grafana_main/ ansible-playbook main.yml -i invThis will bootstrap the instance and create the AMI. Copy the AMI id in the variable file for the instances Terraform module.
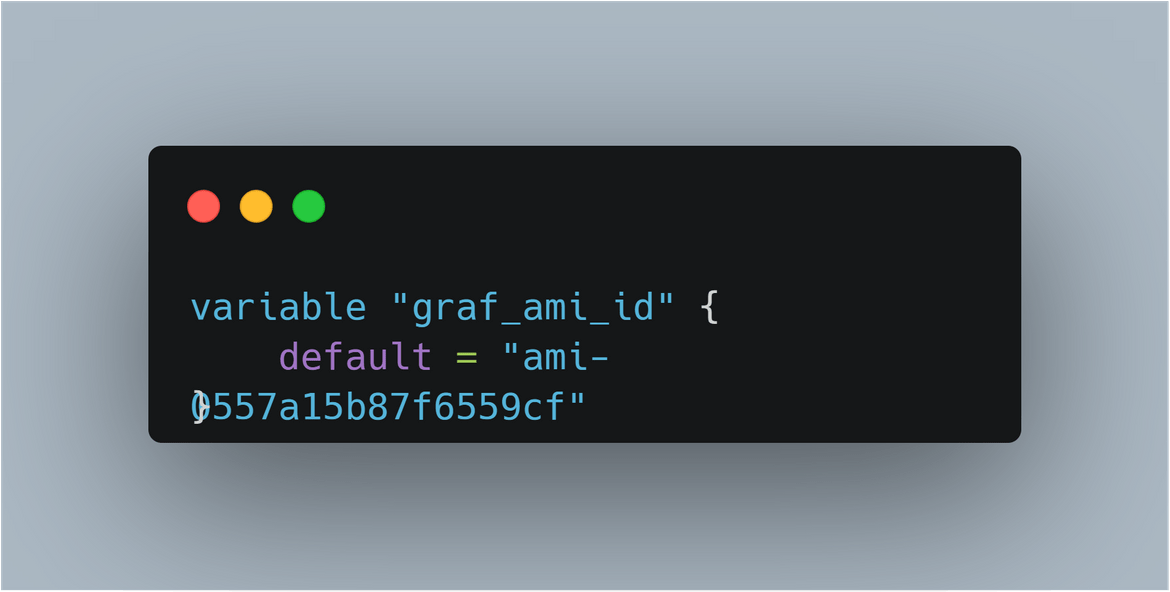
Now you have the AMI ID for Grafana updated on the Terraform module.
Now you have both of the AMIs ready. Next step is to deploy the whole infrastructure and the cluster.
At this point you can go ahead and destroy the infra launched to create the AMI.
cd ami_central_prom
terraform destroy --auto-approve
This will start a destroy run on Terraform cloud.
Deploy the Infrastructure and the cluster:
Now lets deploy the cluster. Make sure to have updated the AMI IDs in the instance module variables. Navigate to the infrastructure folder and run the command to start deploying the whole stack.
cd infrastructure
terraform init
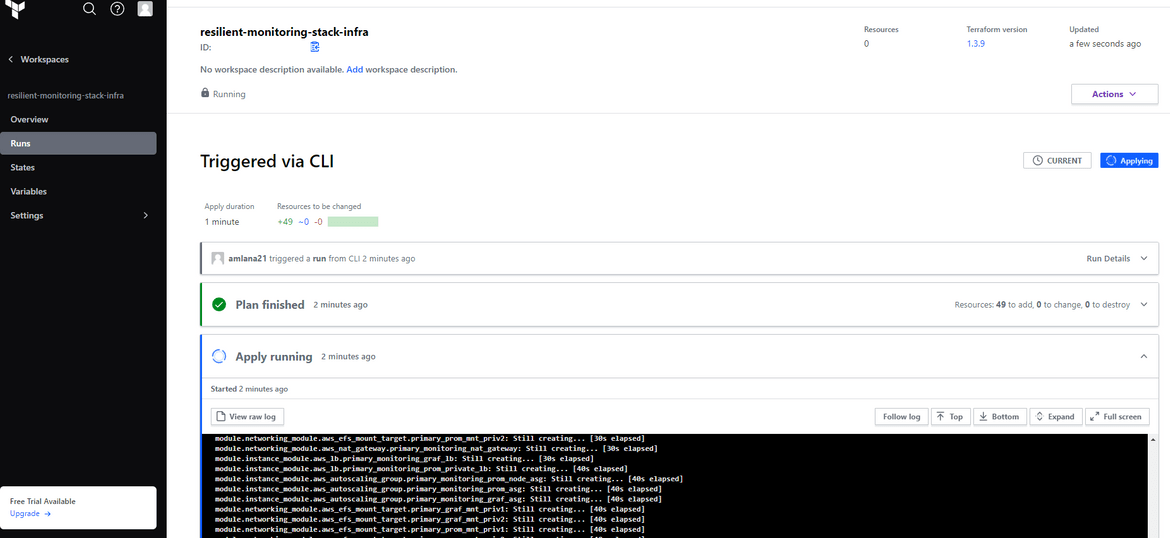
terraform apply --auto-approve
I have created a separate workspace for this infrastructure in Terraform cloud. This starts a new apply run in that workspace.
This run will take a while to run as its deploying many components. Once it completes we can verify the components on AWS.
Two EC2 instances launched by respective ASGs

Auto Scaling Groups and the instances reporting healthy
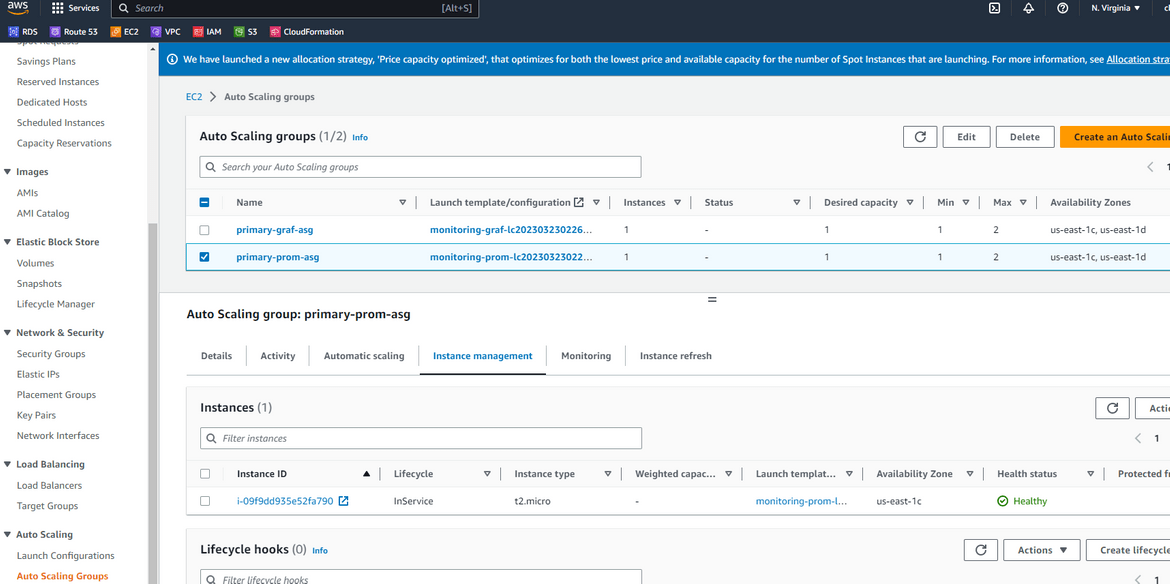
Now the whole stack is up and running. The load balancers will server traffic from the auto scaling groups. Multiple Prometheus and multiple Grafana instances will ensure always there are healthy instances to server traffic and scale accordingly.
Lets see how the instances are working.
Demo how it works
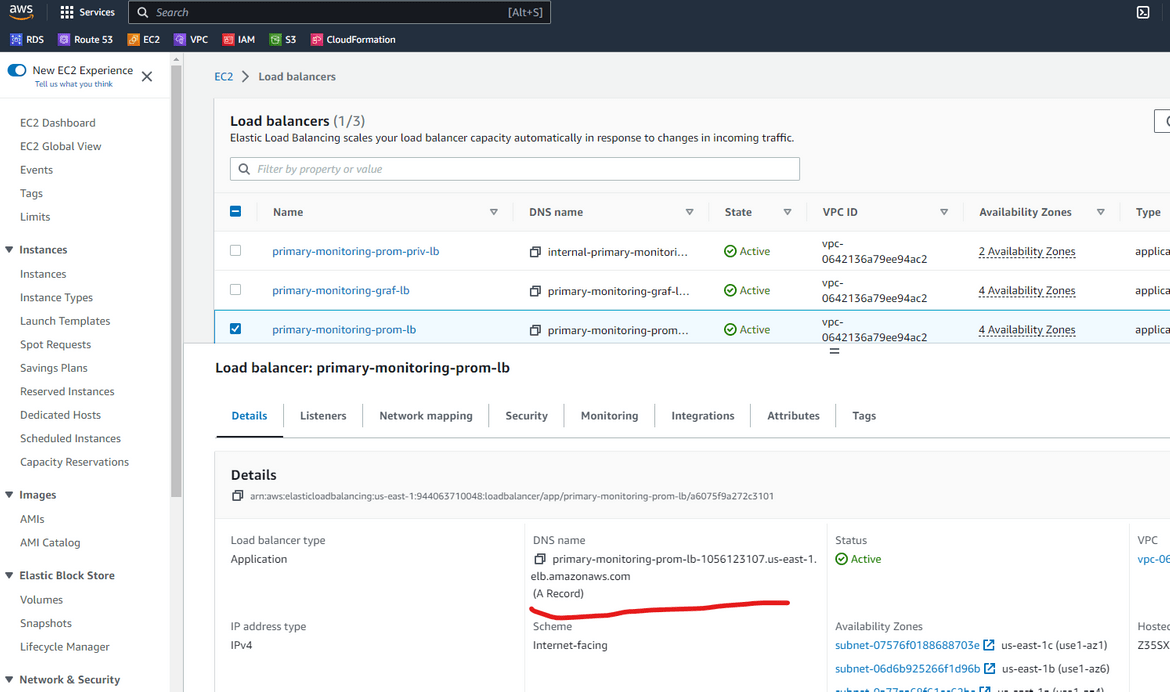
Lets see how the federation in the Prometheus instance is working. Navigate to the public load balancer for Prometheus and copy the dns name. The Prometheus url will be http://<lb_dns>
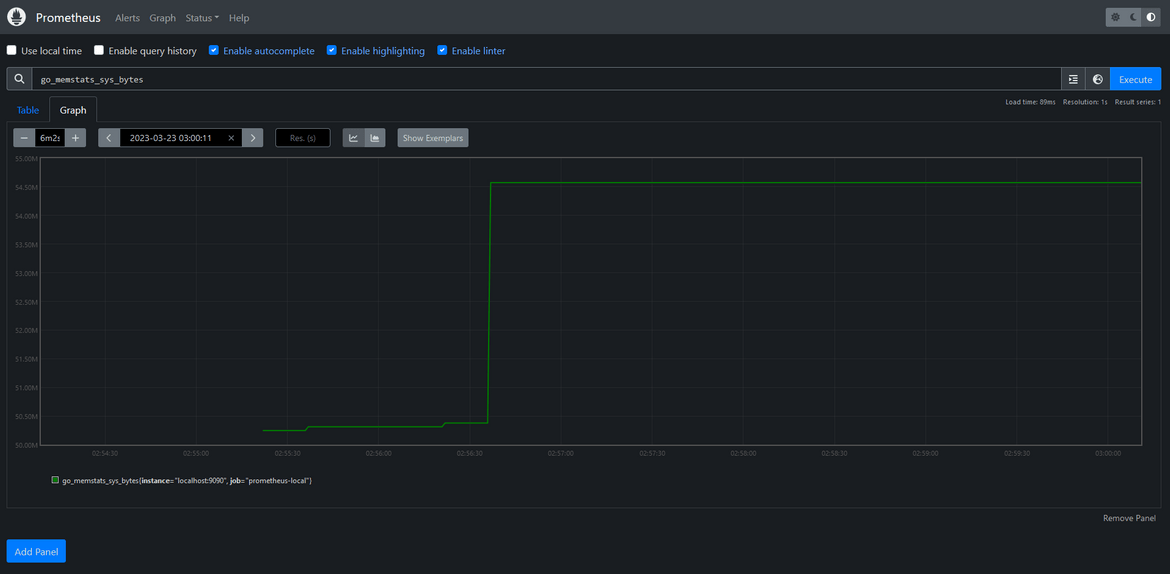
Once navigated to the url, it will open the Prometheus UI. The traffic will be load balanced between the multiple instances under the auto scaling group.
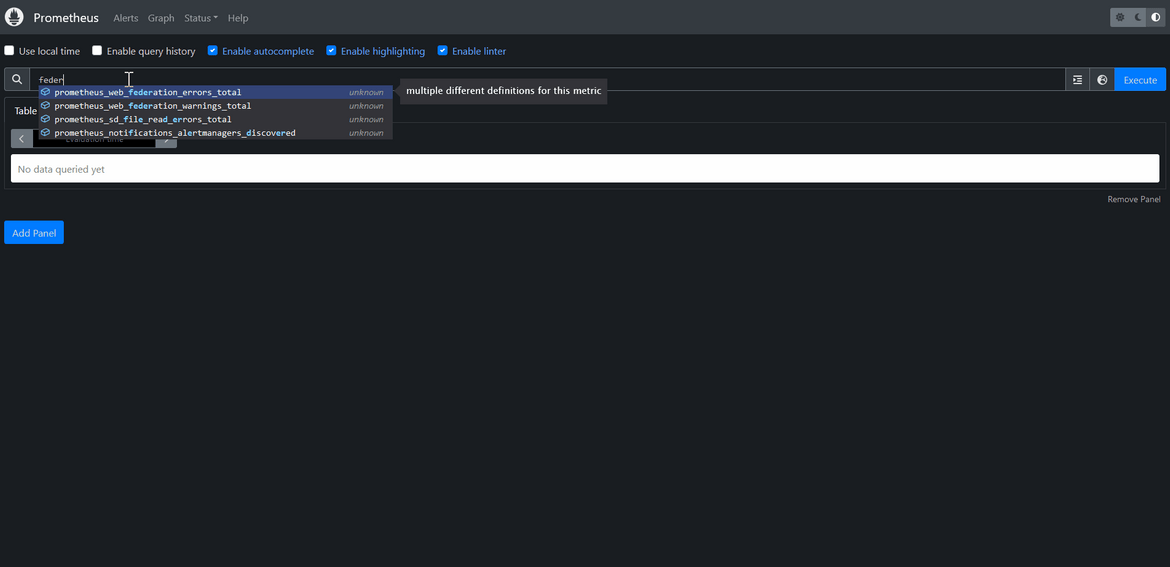
Lets check the federation. Navigate to the Targets page for Prometheus. It will show the federated instances and their status. These are the instances which are part of this cluster and are scraping each other.
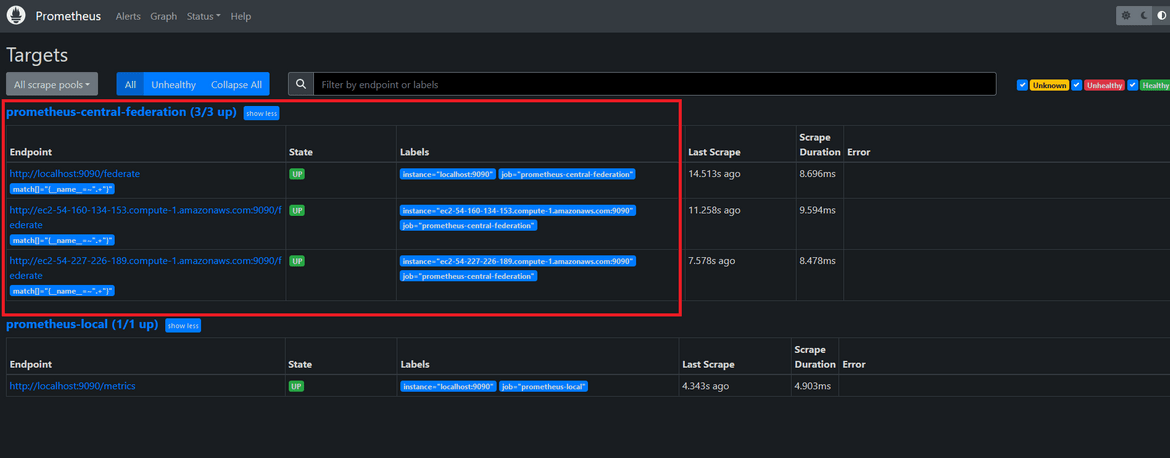
We can perform usual operation on the Prometheus application.
Now lets see how the Grafana is working. Copy the DNS from the Grafana load balancer. The Grafana url will be http://<dnsfromlb>.
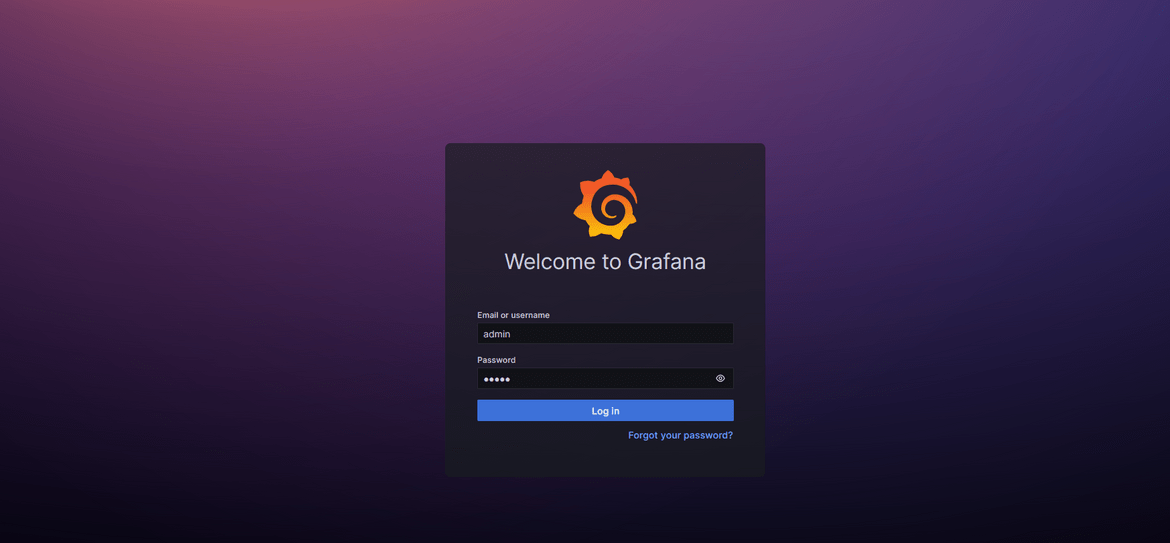
Default credentials for Grafana admin will be admin/admin. You will be prompted to change on first login at which point it can be changed. Once logged in, you should be able to see general Grafana dashboards and pages.
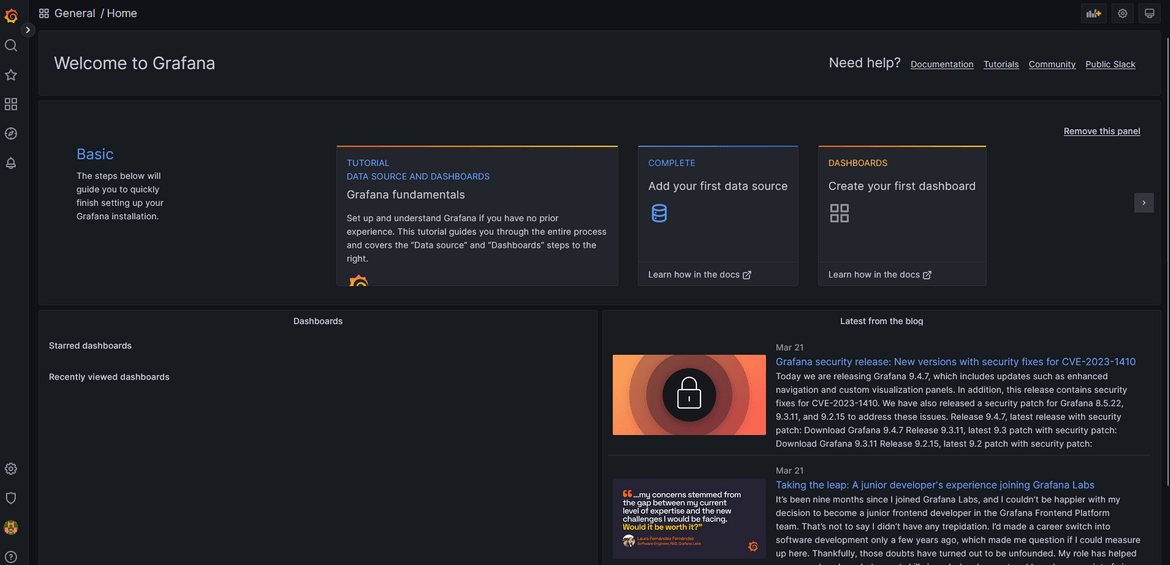
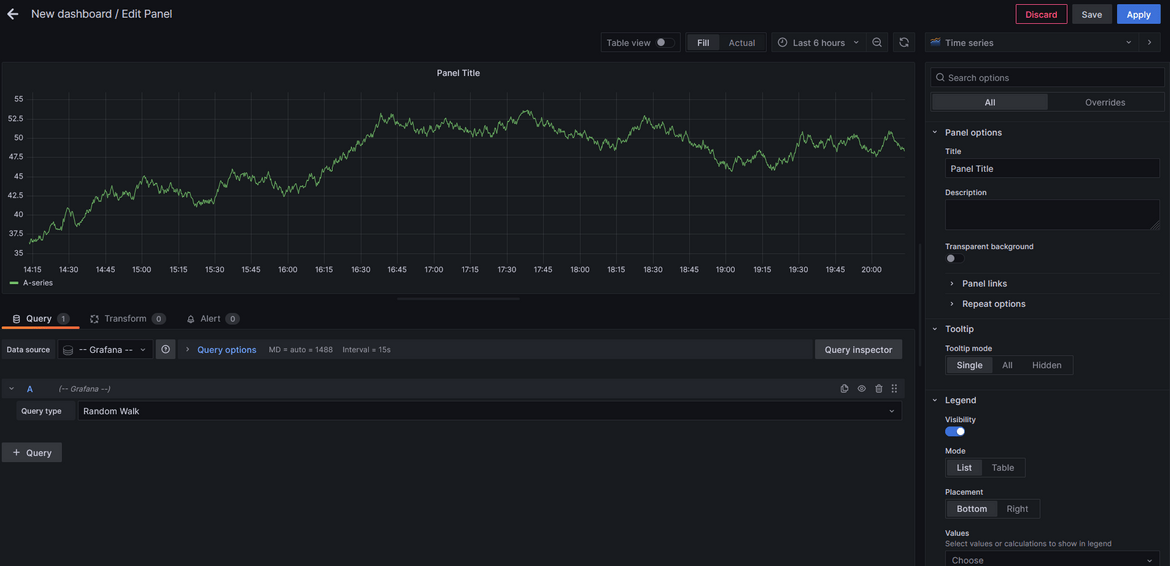
Go ahead and create a dashboard with some default data sources. We haven’t added the Prometheus as data source yet. This data is being served by one of the instances in the Grafana cluster.
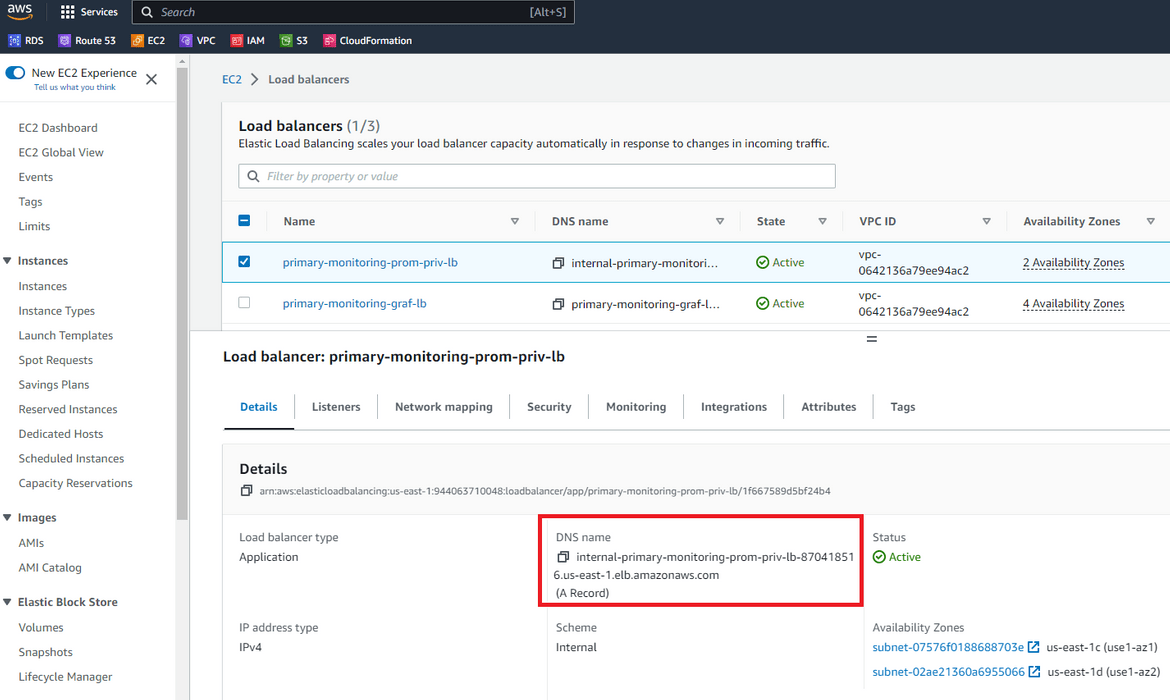
Lets add Prometheus as data source. For that we will need the private URL for the Prometheus load balancer. We launched an internal load balancer for Prometheus which load balances the same instances, but the endpoint is only available internal to the network. Navigate to the internal load balancer and copy the dns.
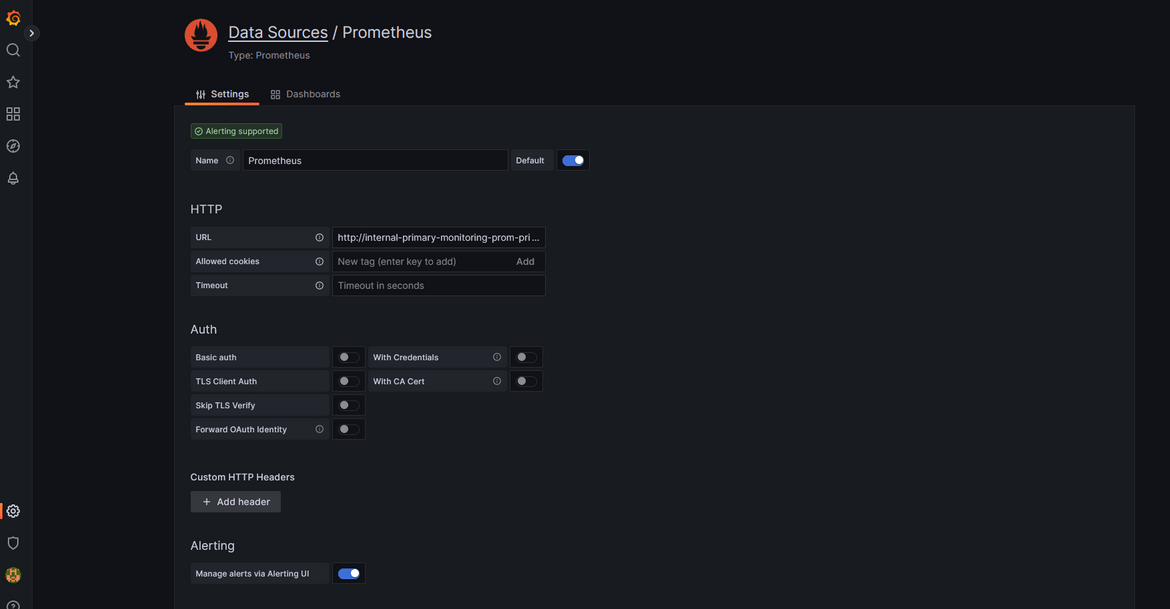
Navigate to Grafana and add a new Data source. Select Prometheus as the type. In the next screen, for the URL provide the internal load balancer dns.
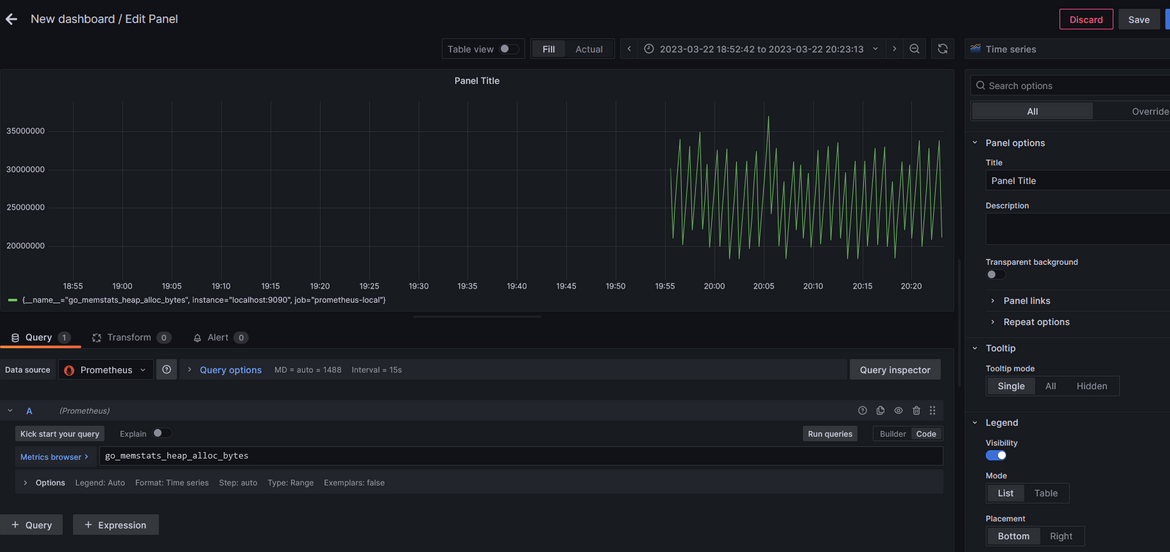
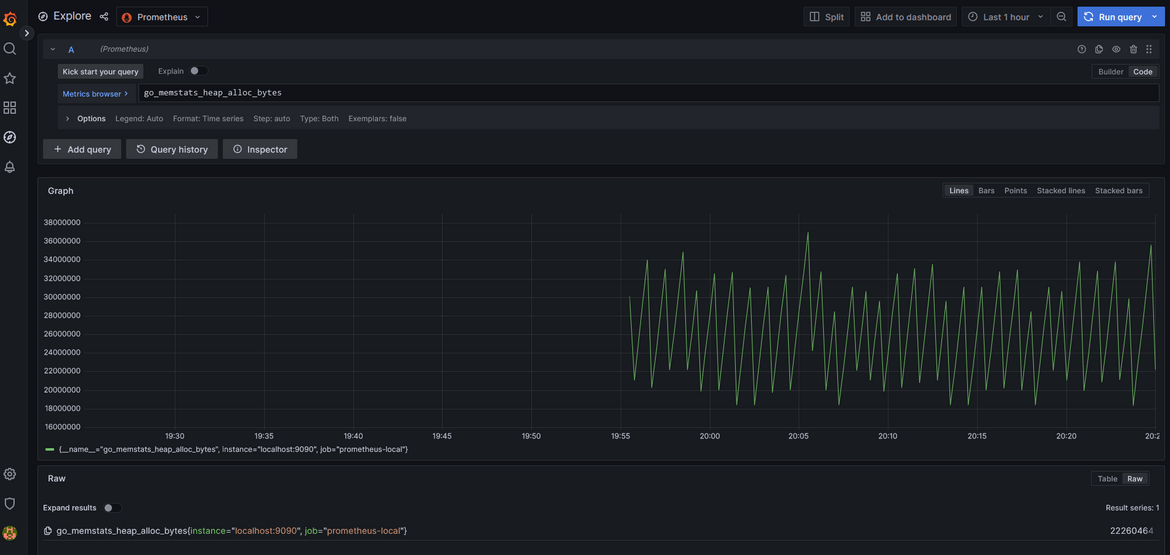
Other settings can be changed as needed or kept default. this adds the new data source to Grafana. Once the data source is added, a new dashboard can be created with this as source.
So now we have a full resilient monitoring stack served by multiple Prometheus instances and multiple Grafana instances controlled by auo scaling. More load on the systems will scale them up to handle more traffic.
Note:If you are following along just for learning, make sure to destroy the stack once done. It launches a lot of resources which may incur cost on AWS.
Improvements
The process which I went through in this post is a very basic step to spin up the clusters. There are lots of other improvements which can be done to the cluster to make it more resilient and more secure. Some notable ones which I am working next are:
- Add TLS certificates on the load balancers to have https endpoints
- For disaster recovery, spin up the same stack in another region and perform regular data sync between regions to have updated data on the secondary region when fail over happens
- Add child worker nodes for Prometheus to handle scraping and sending data to central servers. This is 2nd level of Federation for Prometheus to have higher availability of the cluster
Conclusion
In this post I explained an architecture which can be used to deploy a resilient monitoring stack for any application. Of course there are still improvements which have to be done to make it more resilient. But this post should give you an idea of how to do that. If you have any questions or face any issues, please reach out to me from the Contact page.
