How to Run a data scraping workload on AWS EKS and visualize using Grafana
This post is my solution walkthrough for the bonus Acloud guru challenge from the Cloud resume book by Forrest Brazeal. The book can be found Here. This challenge is a good learning path for deploying workloads on Kubernetes cluster and spinning up a Kubernetes cluster. This post will describe how I completed the challenge and my approach towards the challenge solution. My challenge solution provides a good learning experience for these technologies:
- Kubernetes and deploying to Kubernetes
- App Development (I used Python but in theory it can be anything)
- Data analysis and visualization using Prometheus and Grafana
The GitHub repo for this post can be found Here
Pre Requisites
Before I start describing my solution, I am sure many of you will want to implement this on your own. If you want to follow along, please make sure these pre-requisites are met:
- Some Kubernetes knowledge. This will help understand the workings of the solution
- Jenkins server to run Jenkins jobs
- An AWS account. The EKS cluster may incur some charges so make sure to monitor that
- Terraform installed
- Jenkins Knowledge
- Docker knowledge
Apart from this I will explain all of the steps so it can be followed easily.
About the Challenge
Let me first explain about the challenge and its goals. This challenge was part of the cloud resume challenge book which I mentioned above. At high level the goal here is to deploy a data scraping workload on a Kubernetes cluster and visualize the data using a visualization tool. Below are the objectives which will be achieved by the challenge solution:
- Kubernetes Cluster: A Kubernetes cluster has to be spun up to deploy the workloads. The cluster can be anywhere like AWS or Google cloud. I am using AWS EKS here.
- Data Scraper/Importer application: Develop an application that will scrape data from some public time series data and store in a way to be read by below defined tools. Deploy this application as a workload on the Kubernetes cluster
-
Deploy data analysis tools: To analyze the data some tools need to be deployed on the Kubernetes cluster. These are the tools which need to be deployed on the cluster:
- Elasticsearch and Kibana
- Prometheus and Grafana
I am deploying Prometheus and Grafana for my solution. This will take data source as the data which is scraped by the data scraping application. The data will be visualized on Grafana.
- IAAC Deployment: Whole deployment should be automated using IAAC framework and pipeline. I am using Terraform and Jenkins to automate the whole deployment.
Hopefully that explains what is needed to be achieved in this challenge. Now let me move on to describing my approach to these.
Overall Process
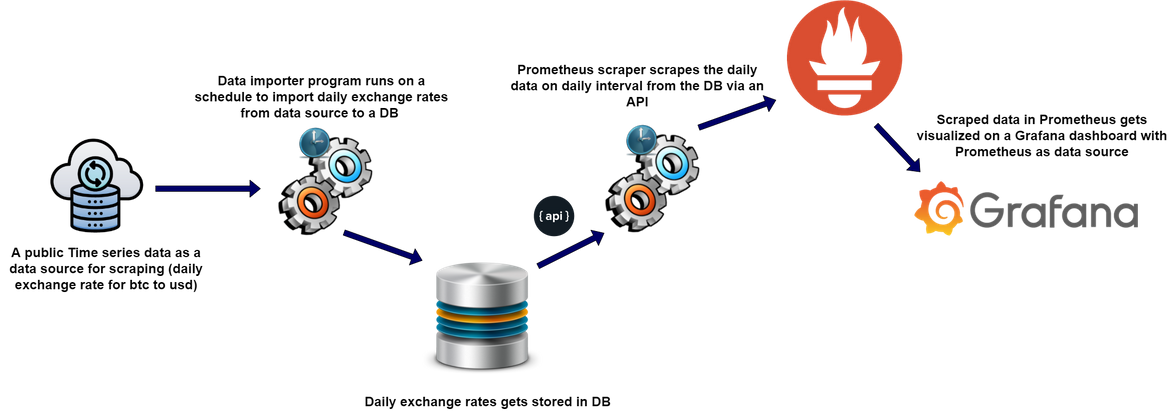
First let me go through the end to end process of the solution and what goes on in the data process starting from data scraping to the visualization. Below image will describe the whole process flow:
Data Source: The process starts with getting the data from a public data source. Here I am using the data source as an API which provides free exchange rates for Bitcoin to USD. This is the API I am using Here . This API will provide the exchange rate between Bitcoin and USD at the moment when the API is called. So invoking the API multiple times provides kind of a time series data for the ups and downs of the exchange rate.
Data Importer App: The data from the data source API above is read by an importer app. This app runs daily and invokes the data source API to get the exchange rate. Then this rate is stored in a data base by the importer app. So the database will have a row of item for exchange rate for each day.
Prometheus Data Scraper: This is a data scrape jobb defined in Prometheus. The Prometheus data scraper scrpaes an API endpoint and gets the data as a metric within the Prometheus. The API is a custom API developed which when invoked, reads the exchange rate for that day from the database and responds with the data in a format which is readable and importable as a metric in Prometheus.
Visualize Data: The data which is scraped by Prometheus is available as a separate metric in Prometheus. This metric is used as a data source to create visualization dashboards on Grafana. These dashboards show various trends of the exchange rate ups and downs as recorded by the metrics.
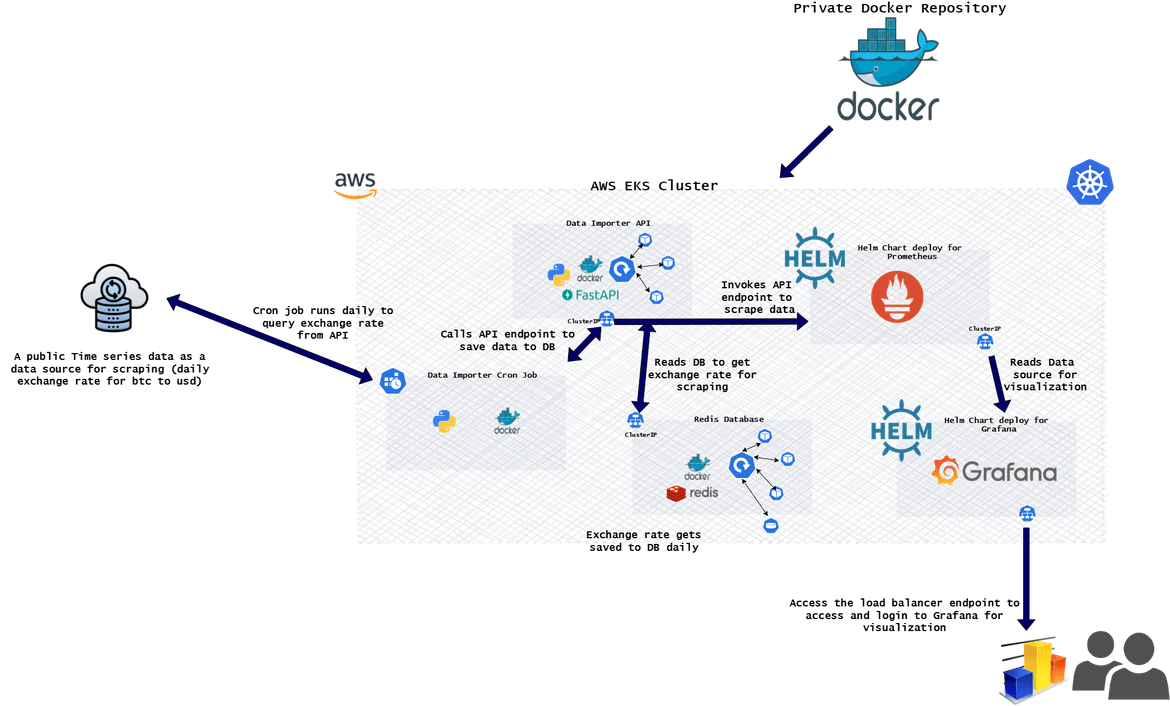
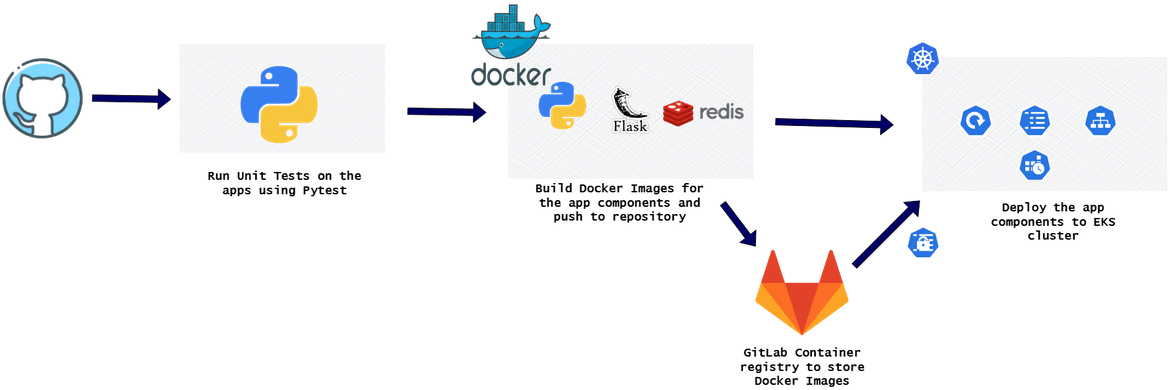
If I have to describe the same process from technical perspective, below image shows how each of the process steps have been implemented:
That explains the whole process which is taking place in this data scraping use case. Now lets see how each part of this process flow is built and deployed.
Tech Architecture and Details
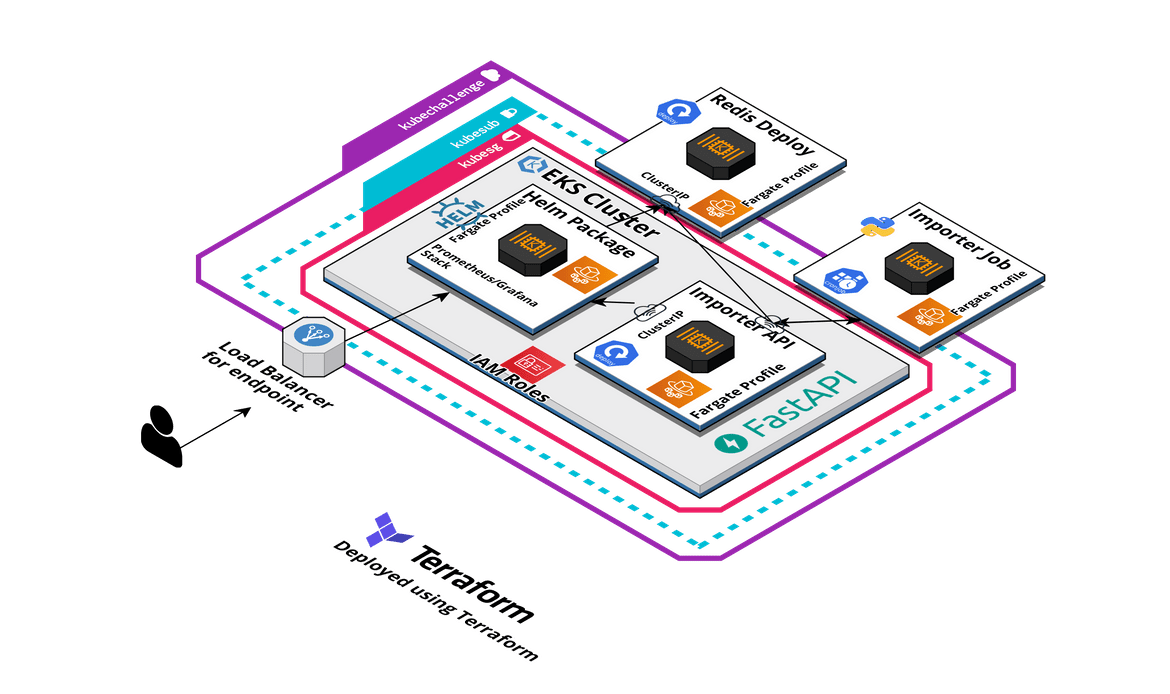
In this section I will explain in detail about how the overall solution is built and technical detail of each component. Below image shows the overall architecture of the solution and deployment.
Let me explain each component in detail and how they work.
Time Series Data Source: The data source used here is a free API which provides exchange rates between dollar and Bitcoin. The details of the data source can be found Here. This API is being invoked periodically to get the exchange rate data.
Data Importer API: This is custom API built using Fast API and Python. There are two endpoints exposed in this API. Below shows the details for this API:
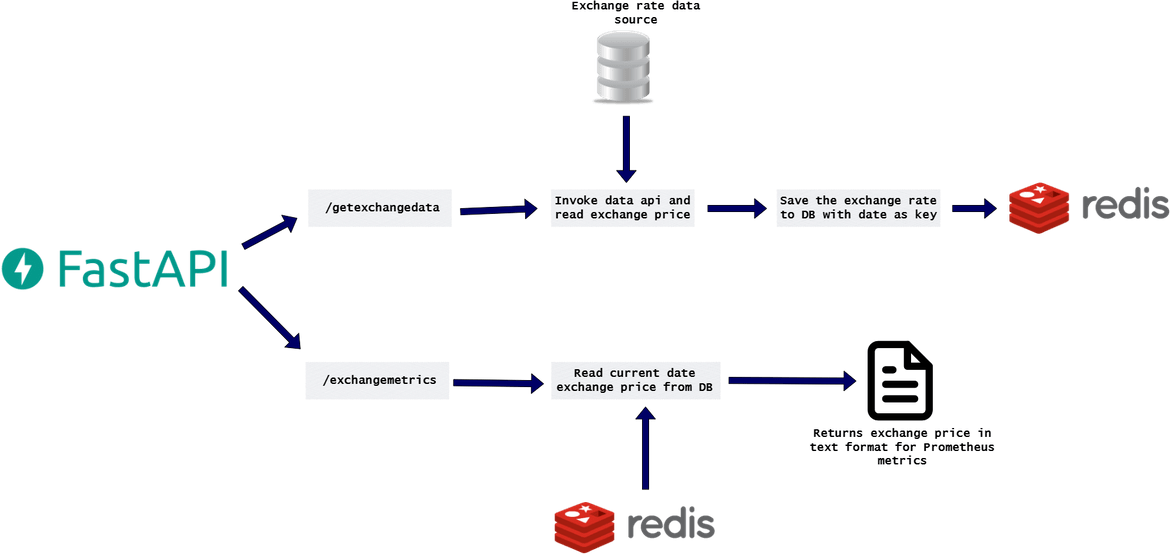
The API is built with FastApi framework. The data source API url is passed as environment variable to the code. The Redis database details are also passed as environment variables. Bot endpoints are used by different components of the whole solution as I will describe below. This API is deployed as a deployment to the AWS EKS cluster. The deployment is exposed via a Load balancer service to expose the API endpoints.
Data Importer Cron Job: This is a Python program which invokes the /getexchangedata endpoint from the above API to get the exchange rate data. Below flow will show what the program does:

The job is a program built in Python. The DB and the importer API details are passed as environment variables. This is defined as a cron job on the AWS EKS cluster. This job runs every 24 hours.
Redis Database: This database is to store the daily exchange prices. The exchange prices are stored each day with the date as key.

The Redis database is deployed as a deployment on the AWS EKS cluster. To expose the endpoint, a ClusterIP is exposed so that the database endpoint is only exposed within the cluster and accessible by the importer API deployment. To have a persistence on the data, a Persistent volume is also deployed on the Kubernetes cluster.
Prometheus Instance: A Prometheus instance is deployed to scrape the exchange rate and generate a metric for the same. The Prometheus is deployed via Helm chart to deploy it to the EKS cluster. Below shows how the data is scraped by Prometheus to get the exchange rate as a metric

Whenever Prometheus scraping job invokes the API, an updated exchange price is returned which gets stored as the time series updated value for the metric ‘exchangeratebtc_usd’ on Prometheus storage.
Grafana Instance: A Grafana instance is also deployed as part of the Helm chart stack. Grafana connects to the Prometheus endpoint for data source and visualize the exchange rate metric as graphs on Grafana dashboards. Grafana accesses the ClusterIP endpoint of the Prometheus deployment within the cluster. This will describe at high level what is happening between Grafana and Prometheus.

The grafana endpoint is exposed a Load balancer service on the EKS cluster. The load balancer endpoint is used to open the Grafana interface. The load balancer is deployed as part of the overall deployment and it spins up a classic AWS load balancer to expose the Grafana deployment. Will cover more about the deployment in later section.
That should give a good idea of the overall solution architecture. Now I will go through how I am deploying each component.
Deploy the Stack
The whole solution deployment is divided into two deployment pipelines:
- Deploy Infrastructure: In this I am deploying the infrastructure components needed to run the whole process.
- Deploy Application: In this I am deploying the application components of the process to the EKS cluster from the Docker images. In this pipeline both of the importer API and the importer Jobs are being deployed
Both of the pipelines are built using Jenkins. Below image shows the whole stack (infra and application)
Deploy Infrastructure
First let me go through the deployment of the infrastructure. This whole infrastructure is deployed using Terraform. Let me go through each component deployment details:
EKS Cluster: Main part of the infrastructure is the EKS cluster. This Kubernetes cluster is deployed via Terraform. In the Git repo, the Terraform scripts are in eks_cluster folder. This is deployed using the eks module in Terraform:
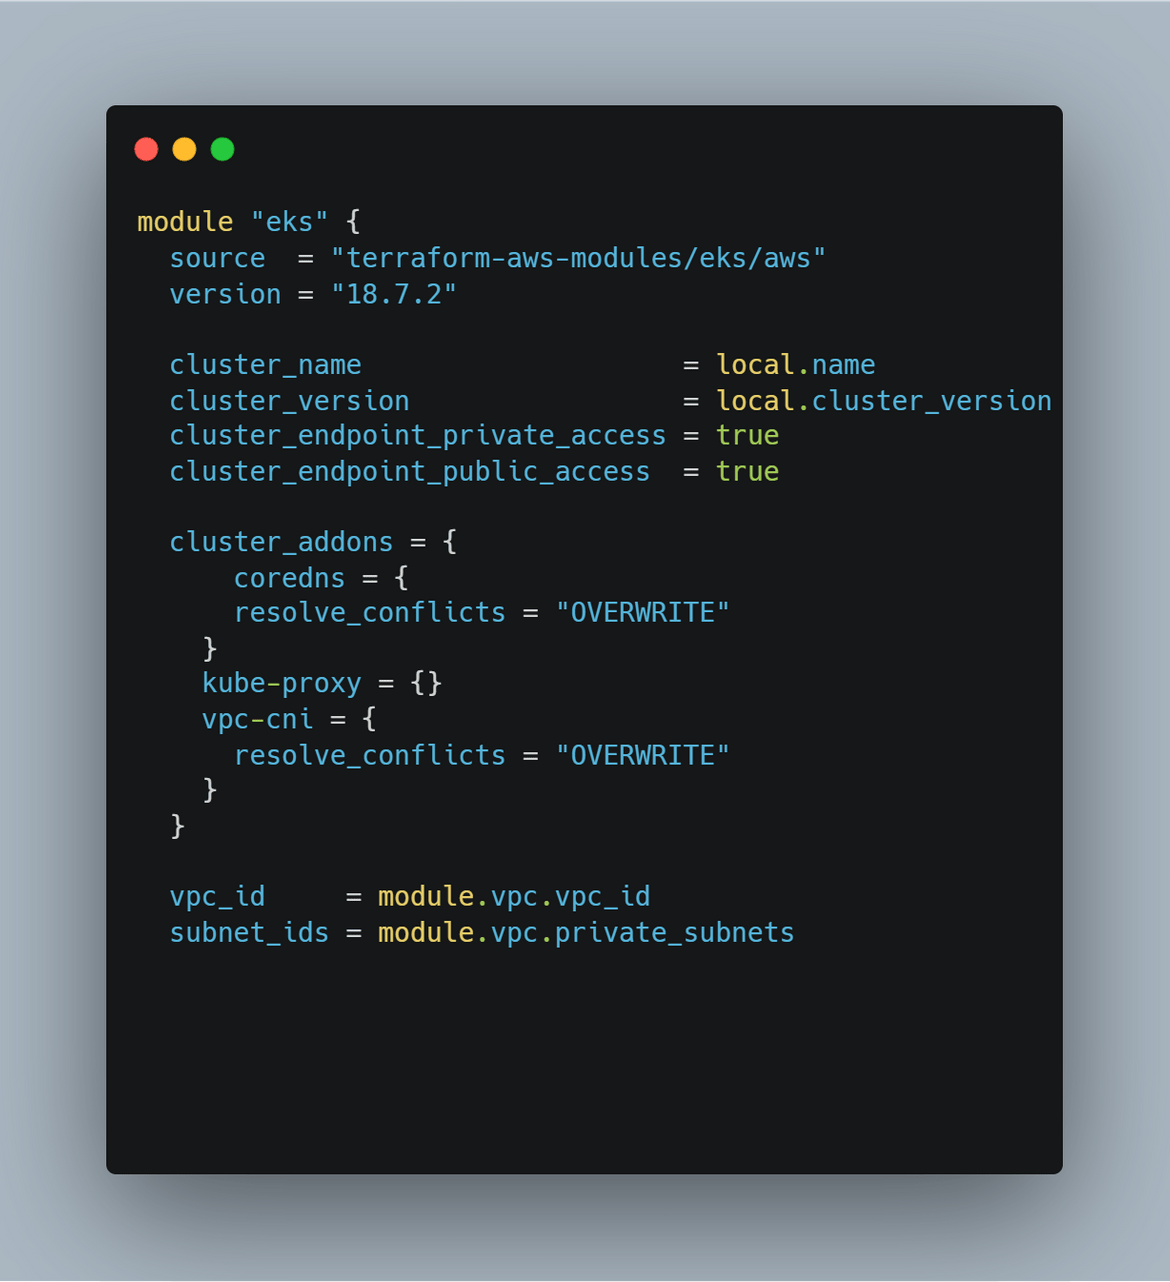
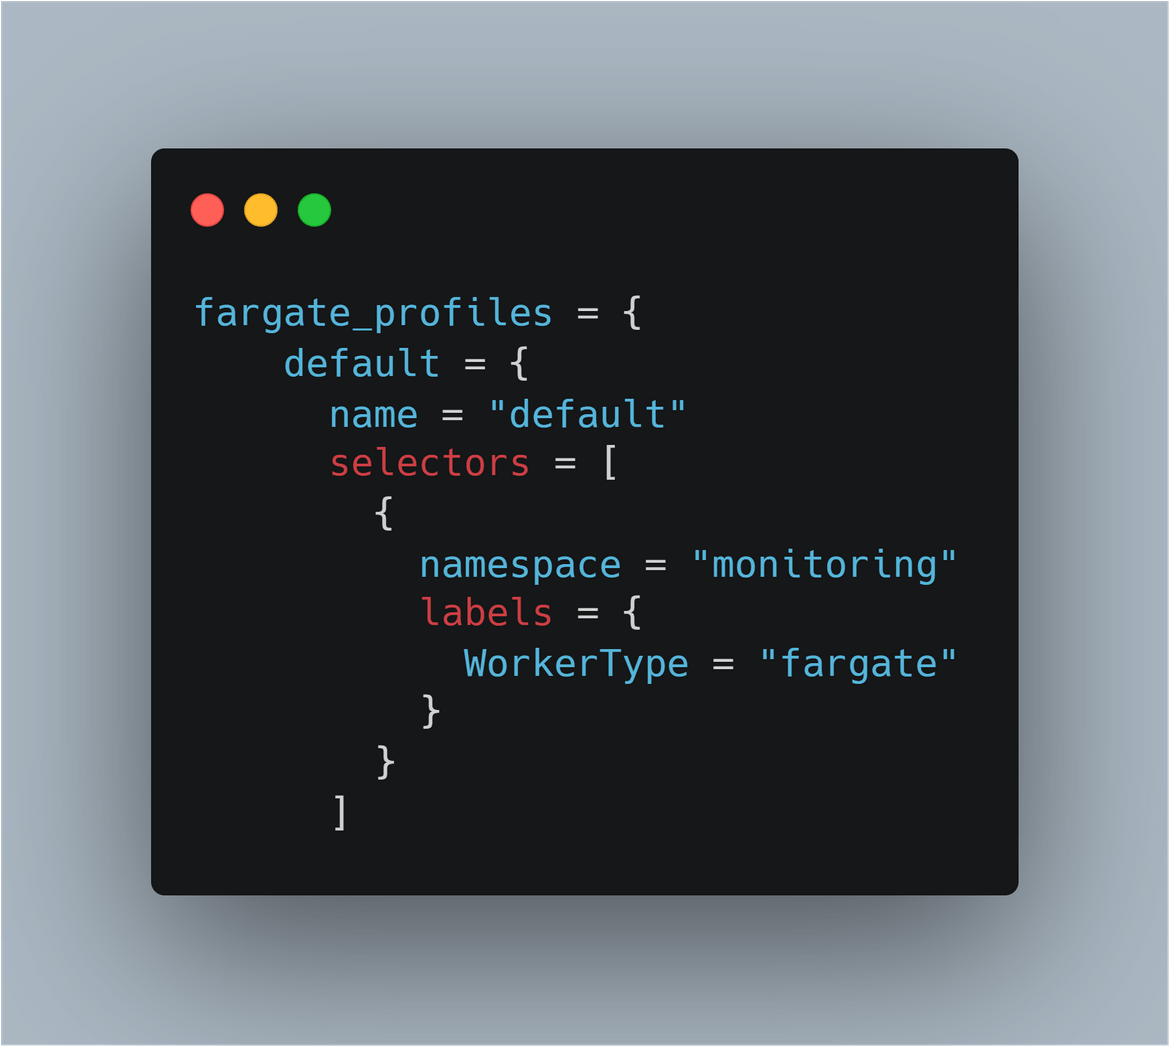
As part of the same script, I am also deploying the needed VPC and Subnets in which the cluster control plane and the nodes will be spun up. I am deploying a private subnet for the cluster and the nodes. For the node group, I am using a Fargate profile. All the pods and deployments will be deployed on Fargate instances based on this profile. The Fargate profile details is defined in the Terraform script. All deployments and pods, having these labels will get deployed on Fargate instances.
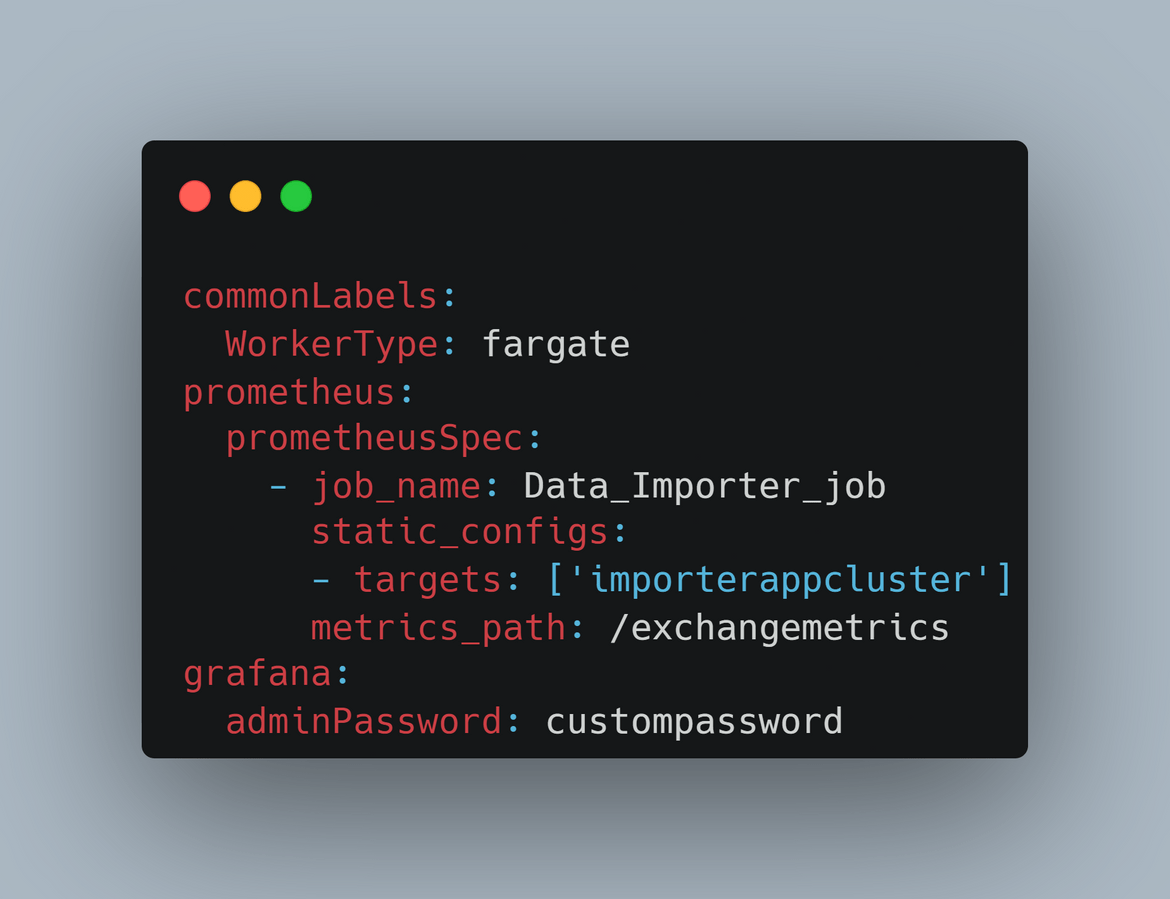
Prometheus and Grafana Stack: Once the cluster is deployed, as part of the infrastructure component deployment, I am deploying the Prometheus and Grafana stack on the EKS cluster. I am using Helm chart to deploy this stack. Details of the Helm chart for the stack can be found Here. This Helm chart deploys both Prometheus and Grafana with basic settings. I have customized some parameters for the stack with a customized values.yml file. These are the things I have customized via the values file:
- Custom scrape job config settings to scrape the custom api endpoint to get the exchange rate as metric. Since the api is deployed as a deployed in the EKS cluster, for the url I am only using the ClusterIP name and Kubernetes cluster will take care of the DNS resolution.
- Custom password for the grafana instance. Since the default Helm chart comes with a default password, I have set my own password to login to Grafana.
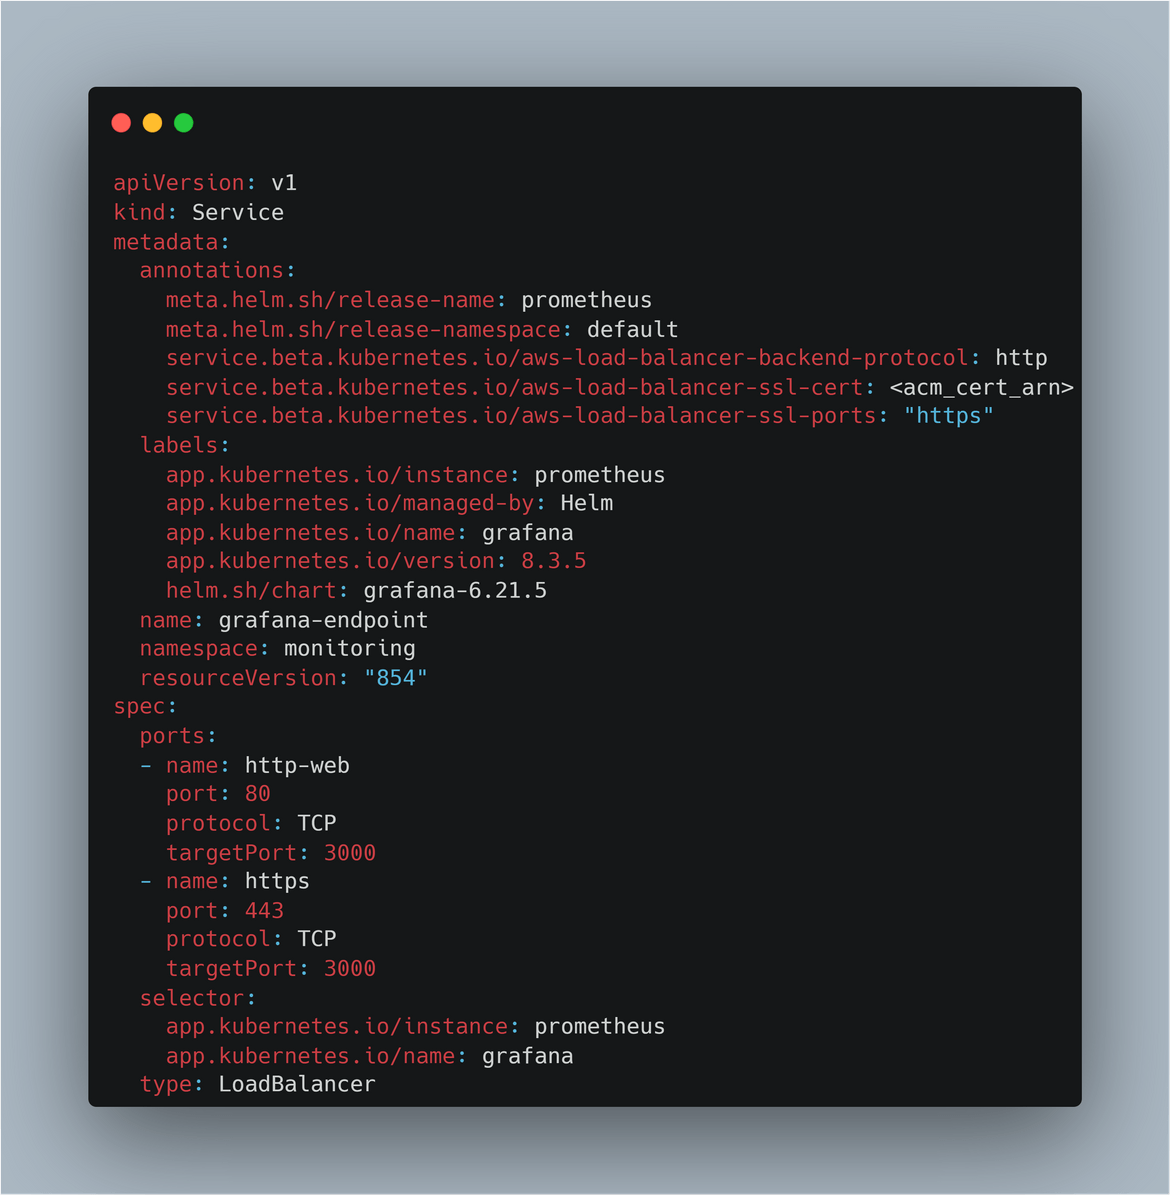
Services to expose Prometheus and Grafana: To be able to access the above deployed Prometheus and Grafana instances, separate services are deployed on the EKS cluster. Below are the services which get deployed as part of the infrastructure deployment:
- Load Balancer endpoint for Grafana: A load balancer service is deployed to expose the Grafana endpoint. The selectors are configured to select the pods deployed for the Grafana instance. I have also enabled https on the load balancer endpoint to be able to access the Grafana endpoint on https. I am using an ACM certificate for the same. This service spins up a classic load balancer on AWS instance.
- Load Balancer endpoint for Prometheus: Similar to above, I am also deploying a Load balancer service for the Prometheus instance. To be able to access and view Prometheus metrics, a load balancer is spun up. At this point the Prometheus endpoint is not secured with credentials but that can be enabled and should be enabled for actual deployments.
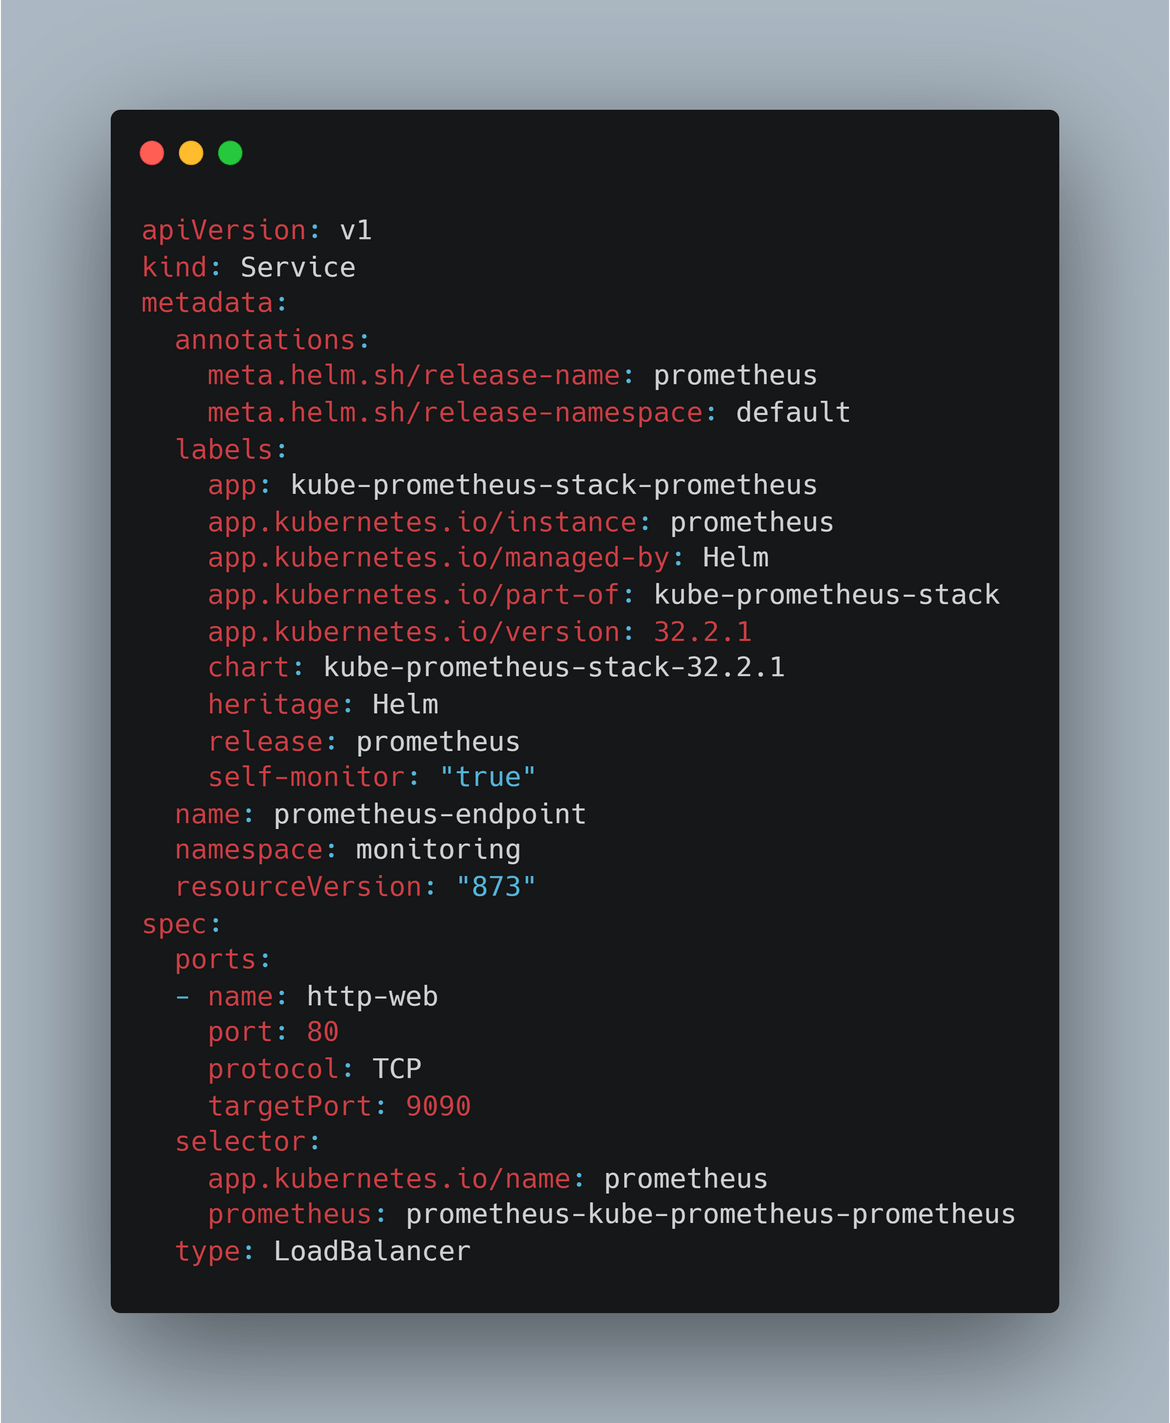
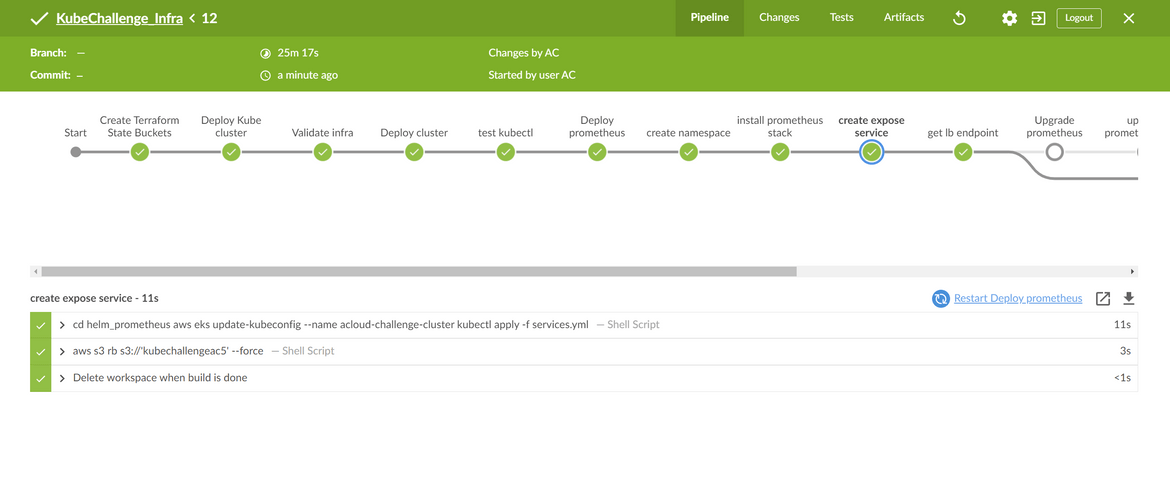
That explains all of the components which are deployed as part of infrastructure deployment. This whole infrastructure is deployed via a Jenkins pipeline. Below image shows what is performed by the pipeline:
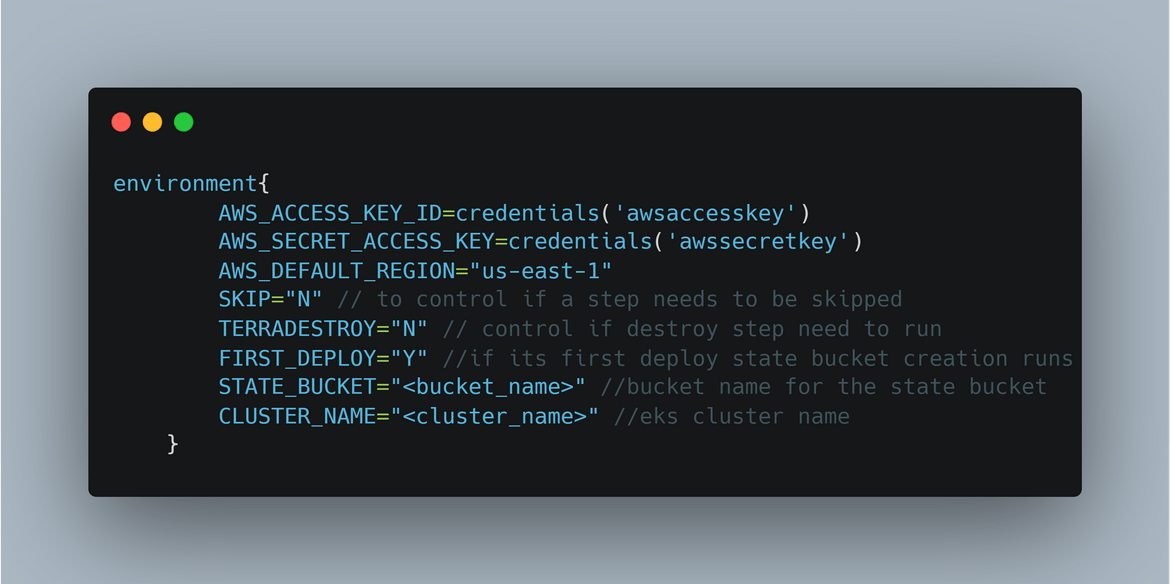
The parameters for the pipeline are passed as environment variables in the Jenkinsfile. The Jenkinsfile is kept at the root folder. There are few flags passed as parameters which control various branches of the pipeline. Below is a snapshot of the parameters passed
Once the pipeline is ran and it completes the deployment steps, as a final step it sends out a Slack message to a Slack channel with the Load balancer URL for Grafana. This makes it easy to access the URL from the channel instead of searching it from the AWS console.
Below is the actual pipeline being executed:
That completes the deployment part for the infrastructure. Now that we have the infrastructure in place, lets move on to deploying the app itself.
Deploy Application
There are multiple components which form the whole application stack. The above Stack architecture also shows the application components which are deployed to the cluster. Let me go through each of the component in detail
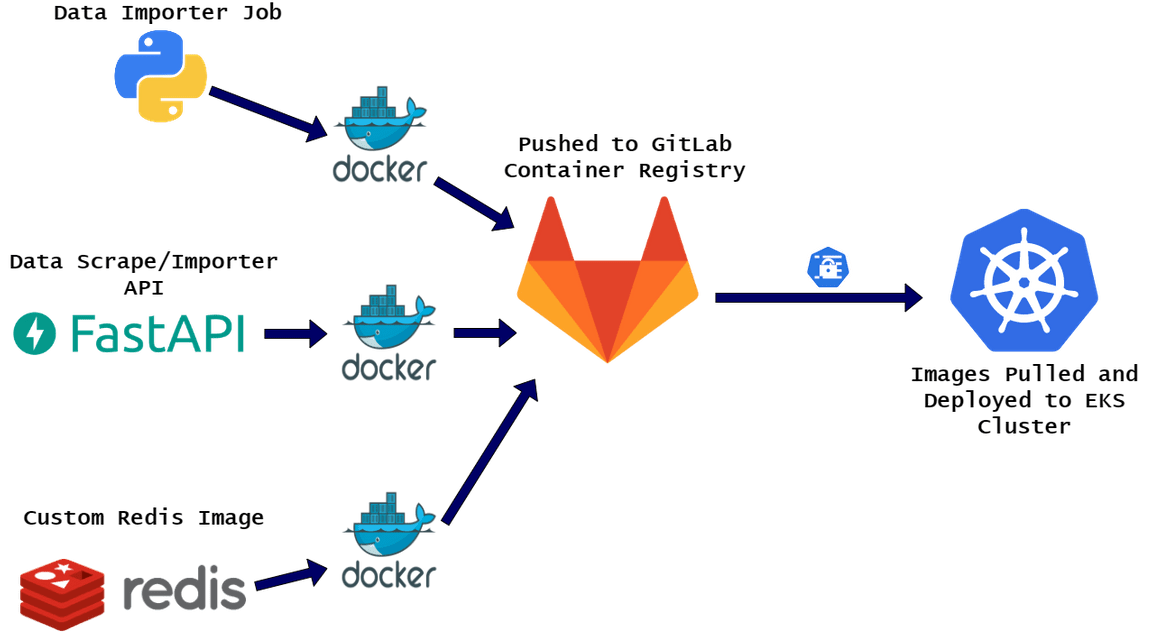
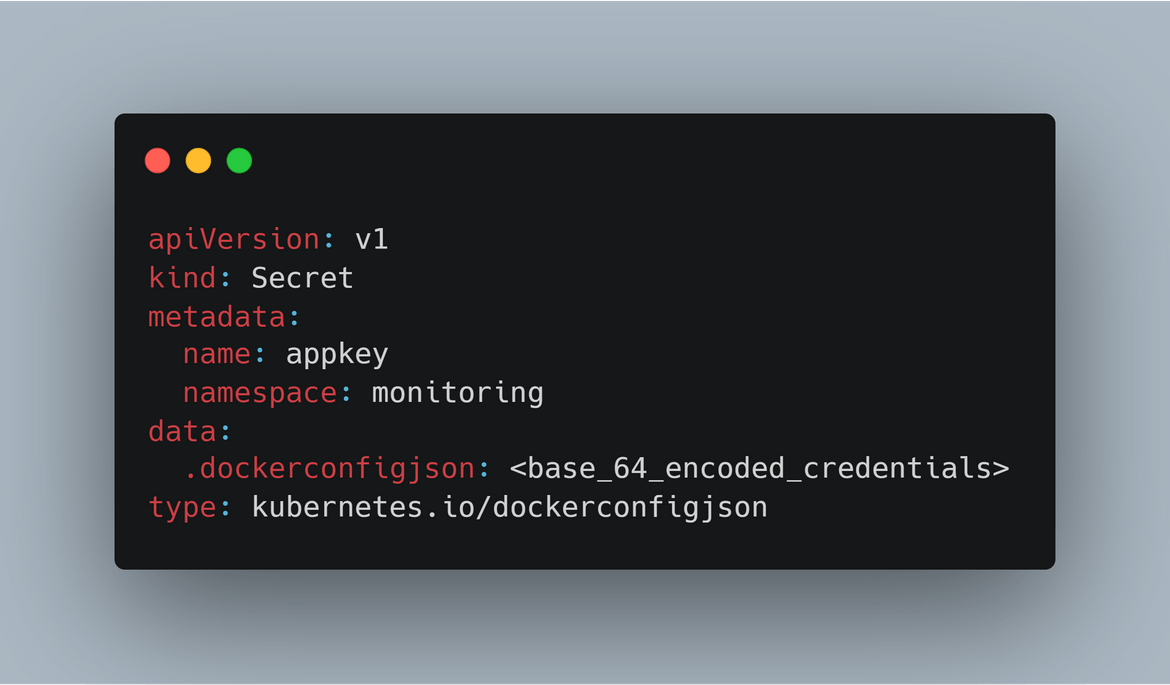
Docker Images and Registry: All of the application components are first built as Docker images to be deployed to the EKS cluster. All of these Docker images gets stored in a registry from where the cluster pulls the images. I am using Gitlab container registry as my image registry. I am storing my images in the Gitlab registry and thats where the cluster pulls the images from. For cluster to be able to connect to the registry, I am passing a secret in the yaml file which is used to authenticate with the registry.
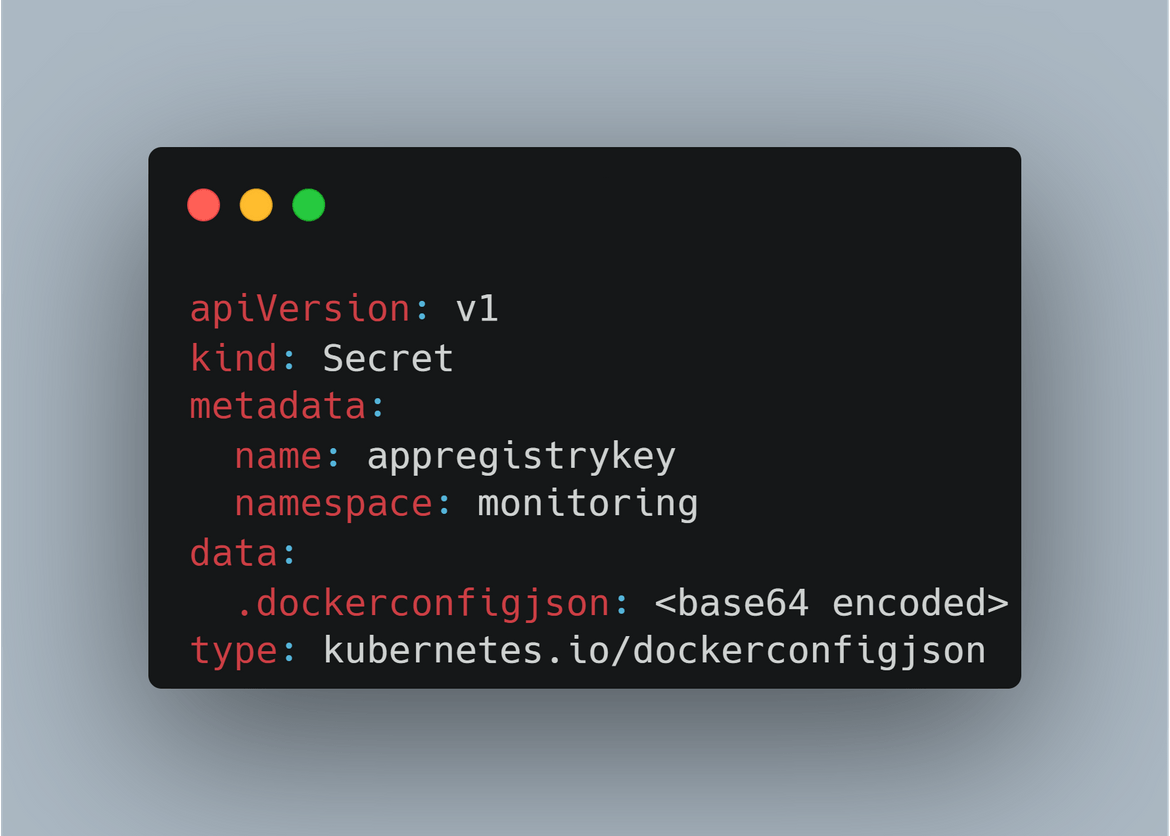
If you want to learn more about the Gitlab registry go Here.
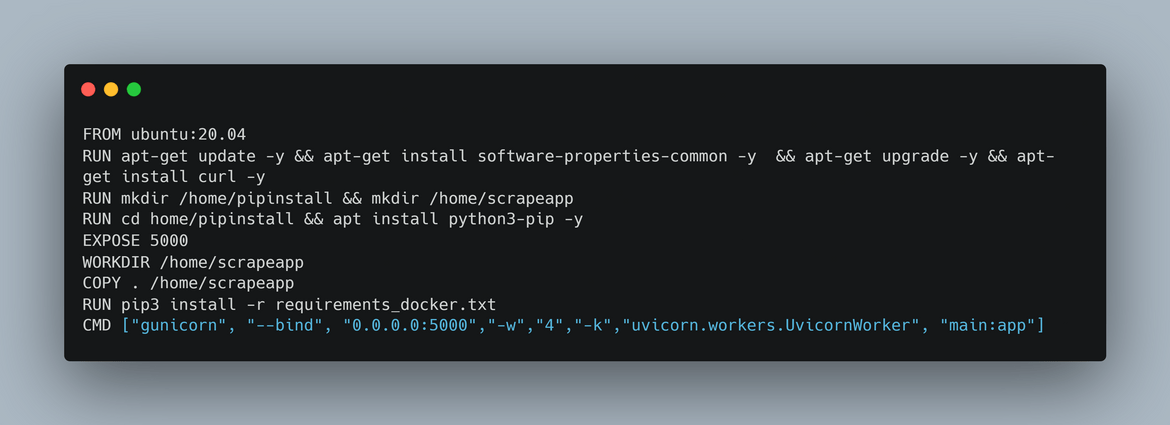
Data Scrape/Importer API: This is the Flask API application which needs to be deployed. To build the Docker image, a Dockerfile has been created and is in the api code folder. Below is what the Dockerfile does
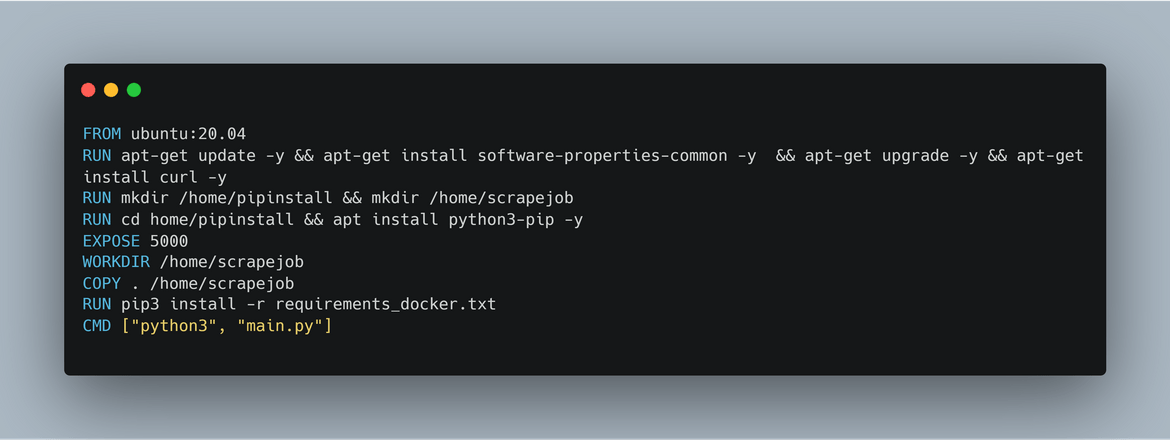
Data Importer Job: This is the Python application which runs as a Cron job and pulls the data from the exchange rate public API. This application is built to a Docker image to be deployed to the EKS cluster. Below is the Dockerfile which creates the image for this app:
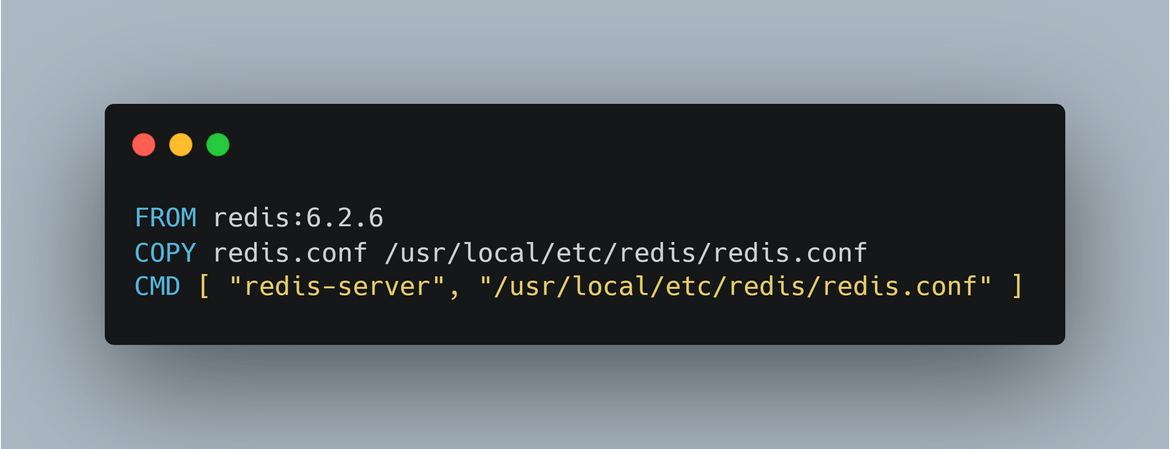
Custom Redis: To store the daily exchange prices, I am using a Redis database. For the Docker image, I am not using the default image but customized the same by adding a custom Redis config file to the image. This is to have my own secure Redis DB image. Below is the Dockerfile for the same:
To undersatnd how each of the above components are deployed, we will have to understand how these are deployed as components on the EKS cluster.
Deployment YAMLs
All of the app components are defined in YAML files which are stored in the code base. The YAML files define all of the different Kubernetes components to be deployed which build up the whole application. Let me go through each of the YAML file.
configMaps.yml:
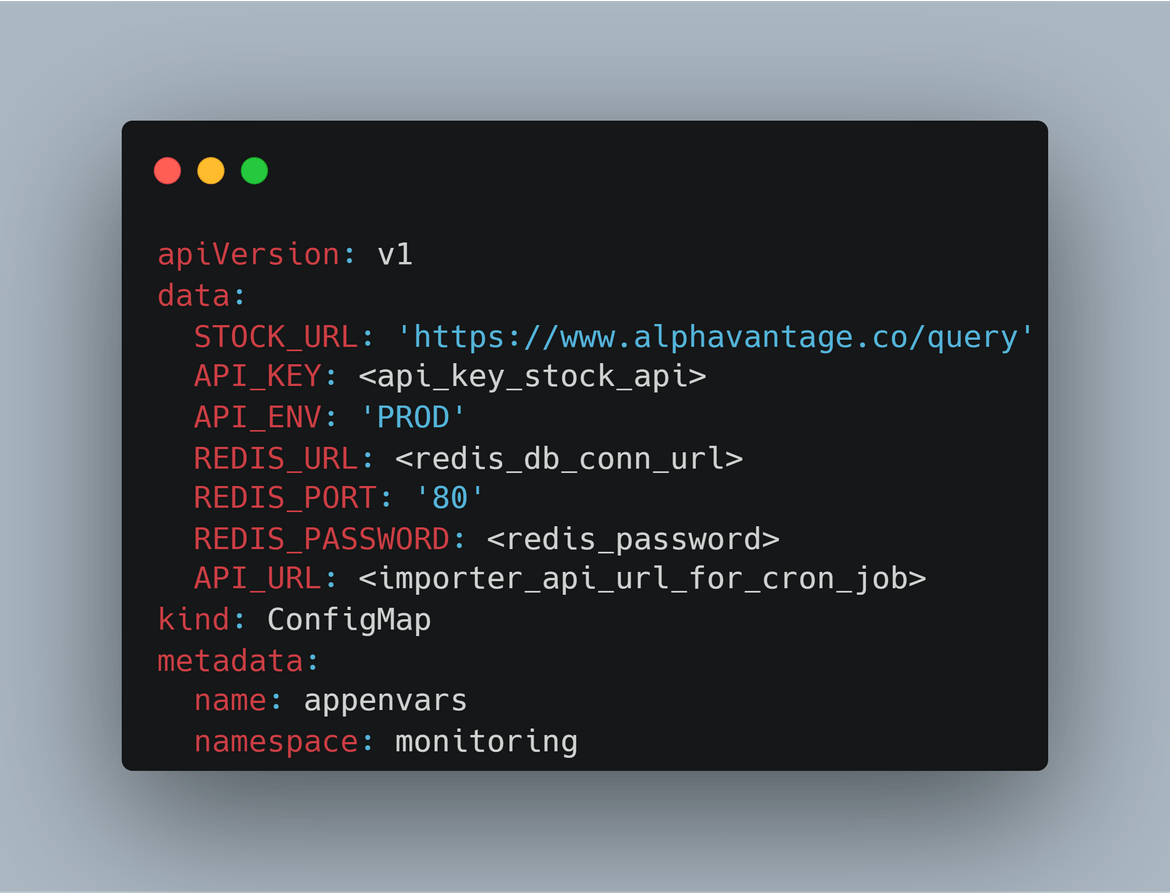
This is the yaml file to define the configmap. This configmap contains all of the environment variables to be used by the importer job and importer API app. These parameters are passed as environment variables to the deployment for the api and the cron job.
app.yml: This file defines all the different components to be deployed for the application and the job. Let me explain each of the parts which are deployed by this file
Secret:This is secret created which is used to pull the images from the Gitlab container registry. This secret is passed to the deployments to be able to get authenticated and pull the Docker images
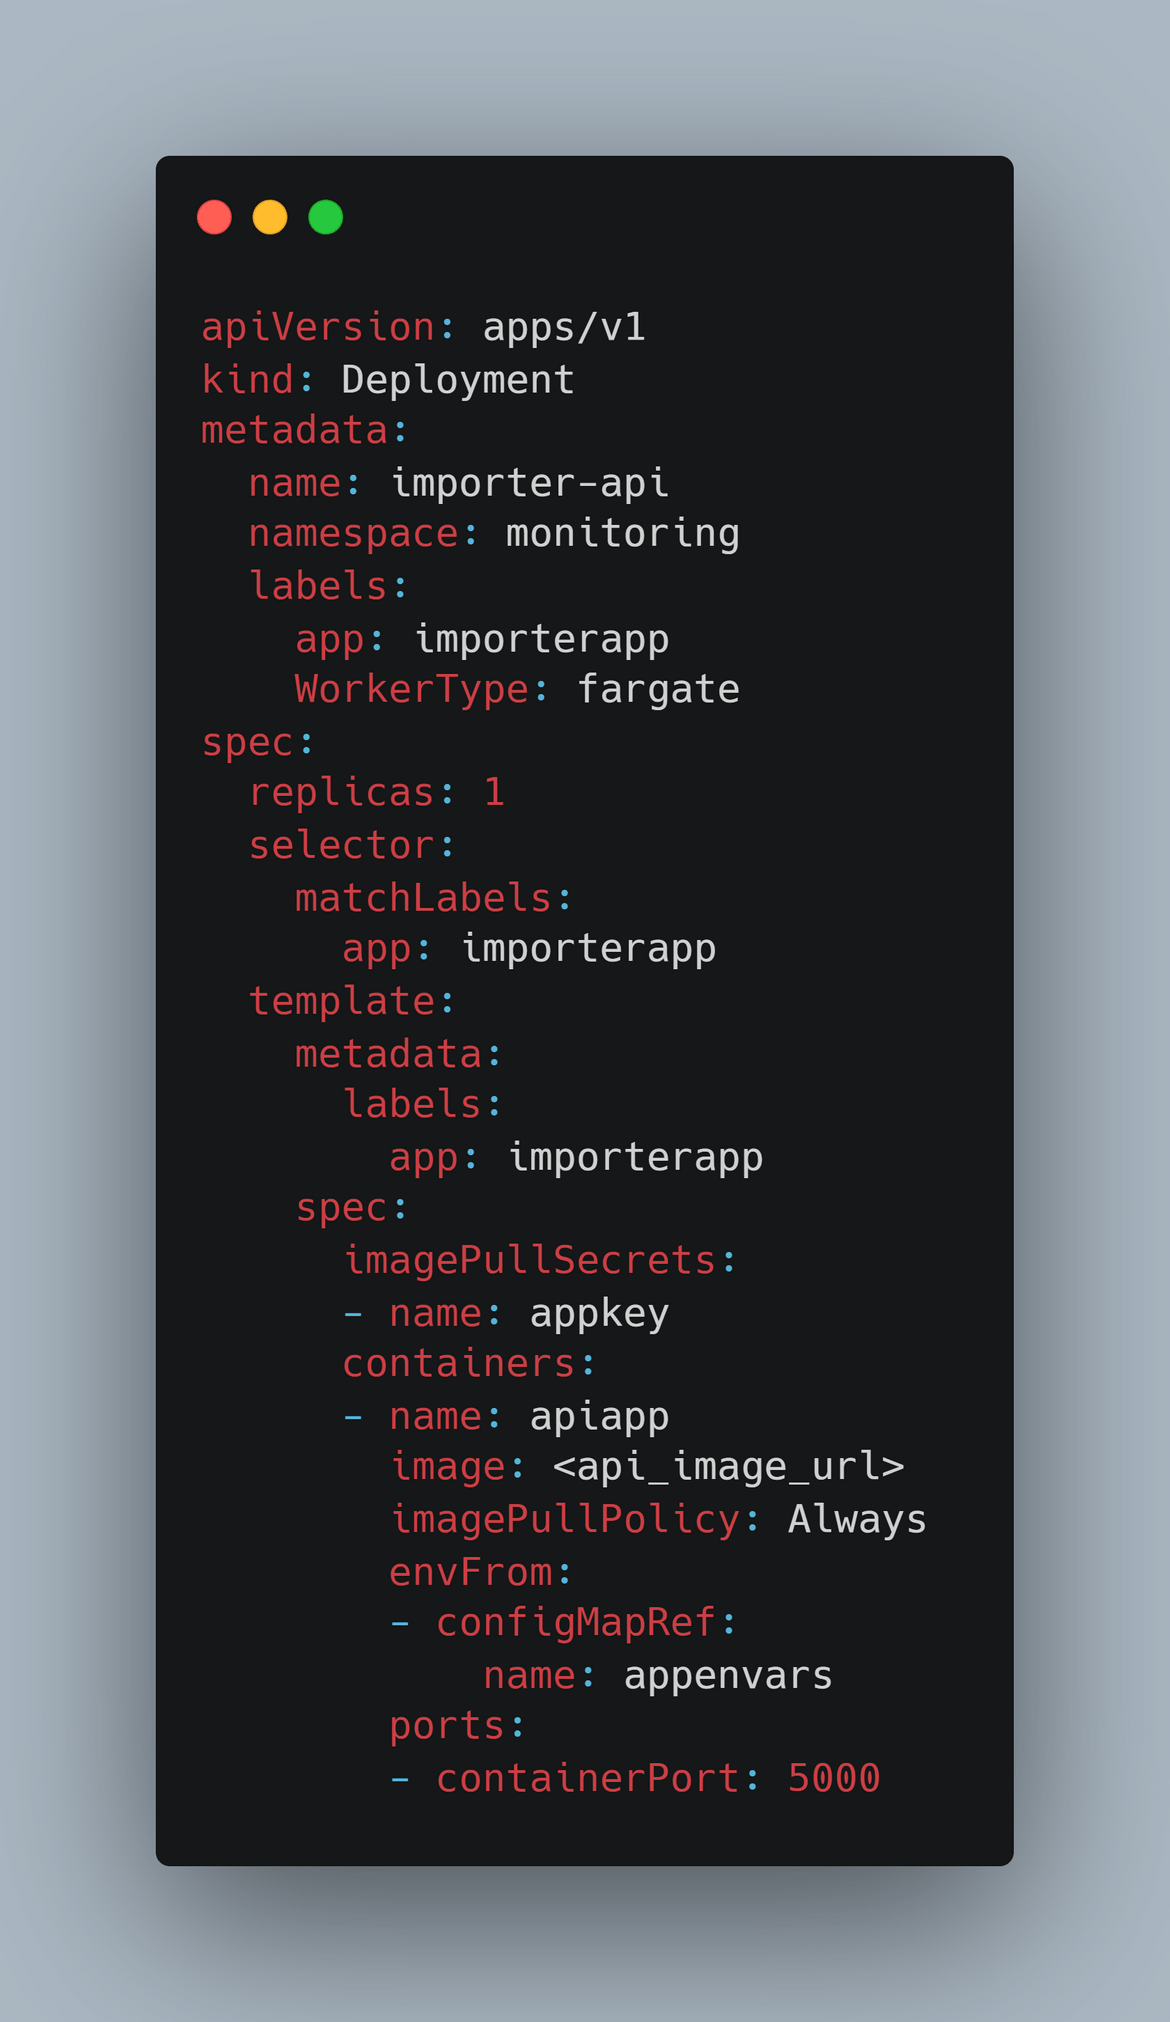
Importer API Deployment:This defines the deployment for the importer API. This deploys the Flask API. The environment variables are passed from the Configmap. Also proper labels are applied so the Pods get deployed to the Fargate instances on EKS.
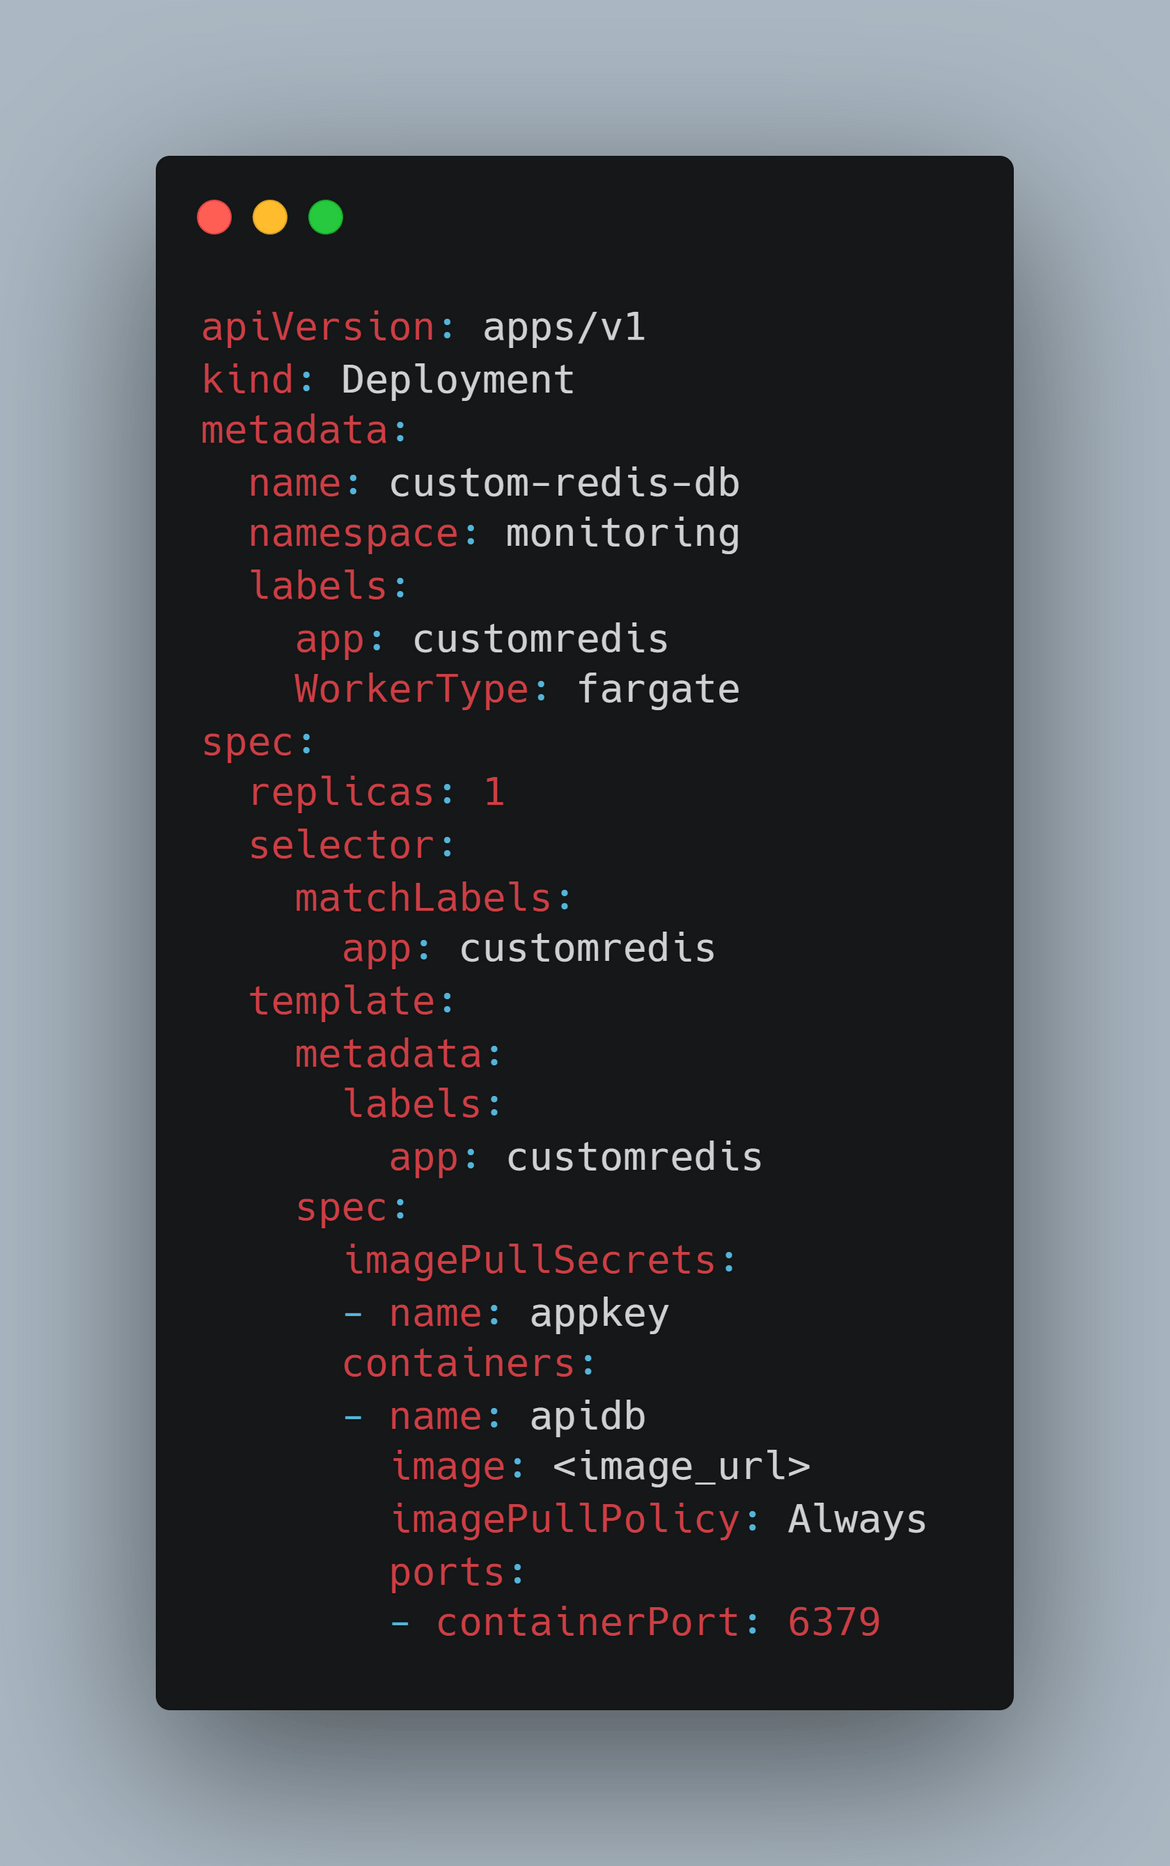
Custom Redis Deployment:I am using a Customized Redis deployment for the application. The customized image gets deployed as a deployment to the EKS cluster. Labels are assigned to the deployment to ensure pods are deployed to the Fargate instances.
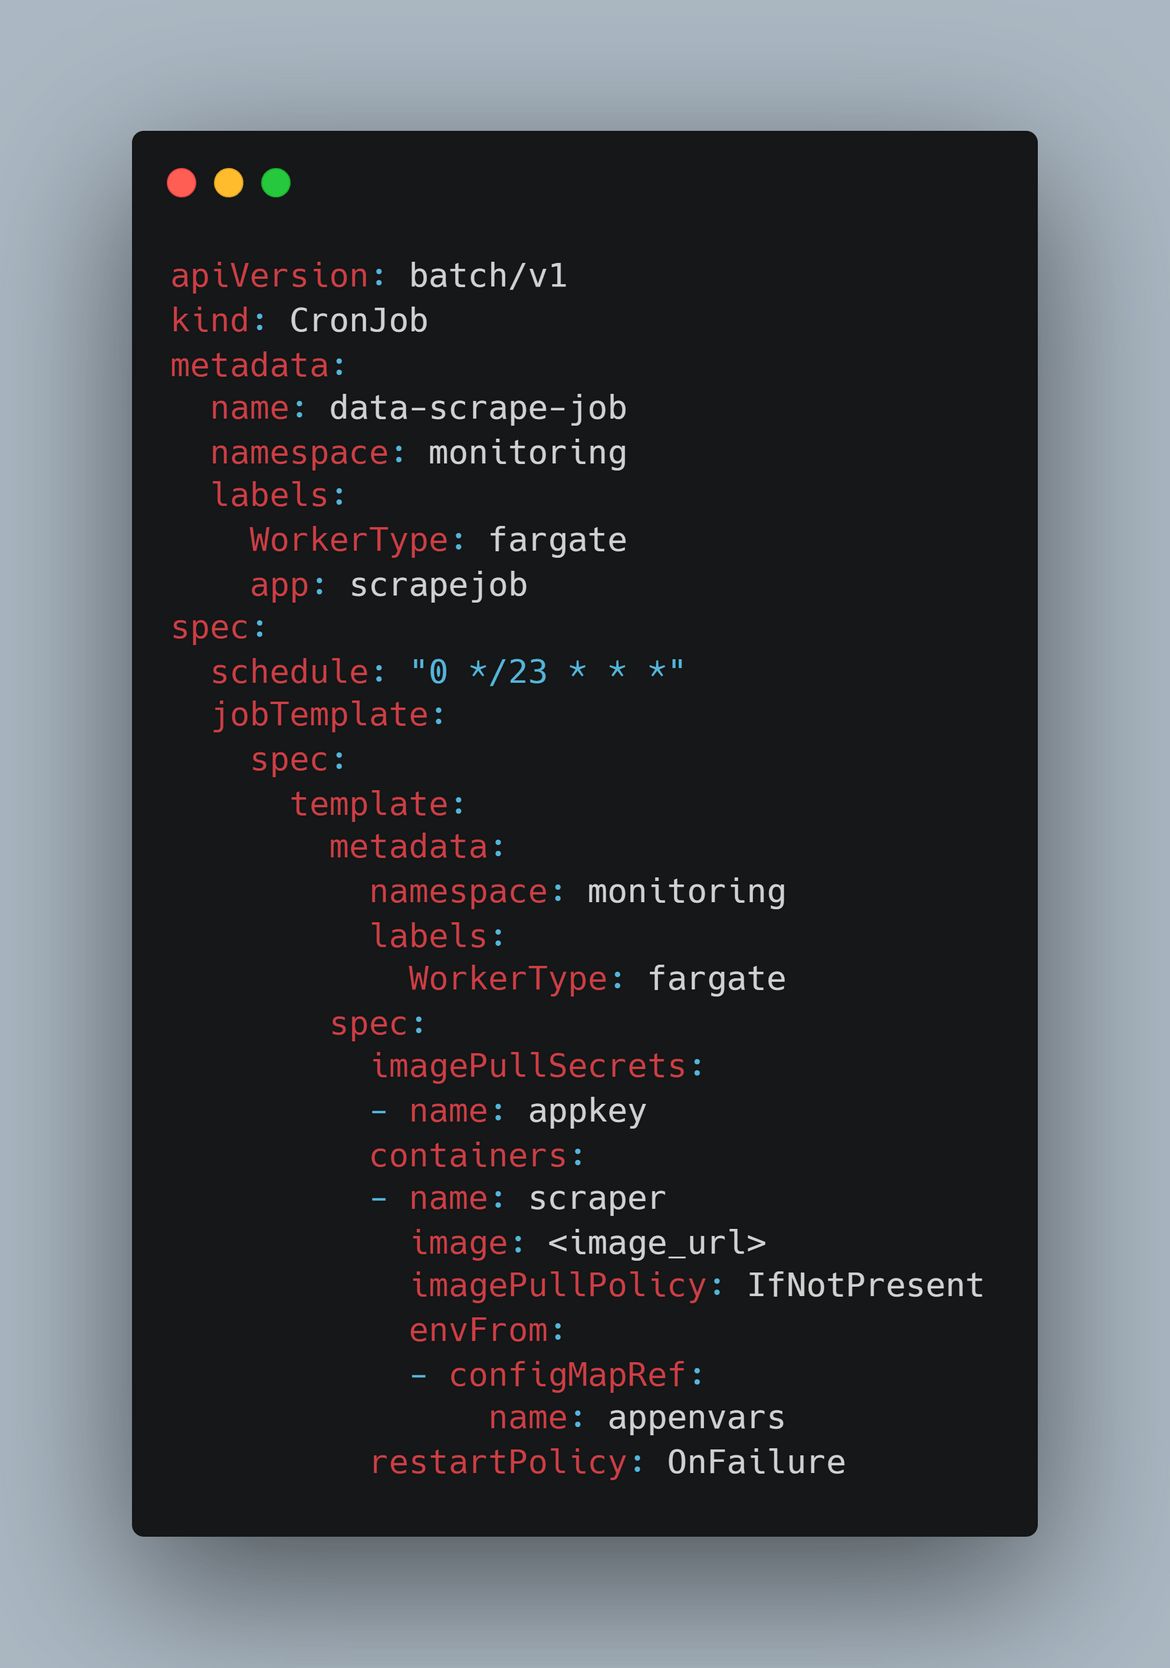
Importer Cron Job:Here I am deploying the Cron job which runs periodically to pull the exchange prices and put in DB. Its scheduled to run every 23 hours. The required parameters are passed on as environment variables from the Configmap. Also proper labels are added to make sure the pods are deployed to the Fargate instances.
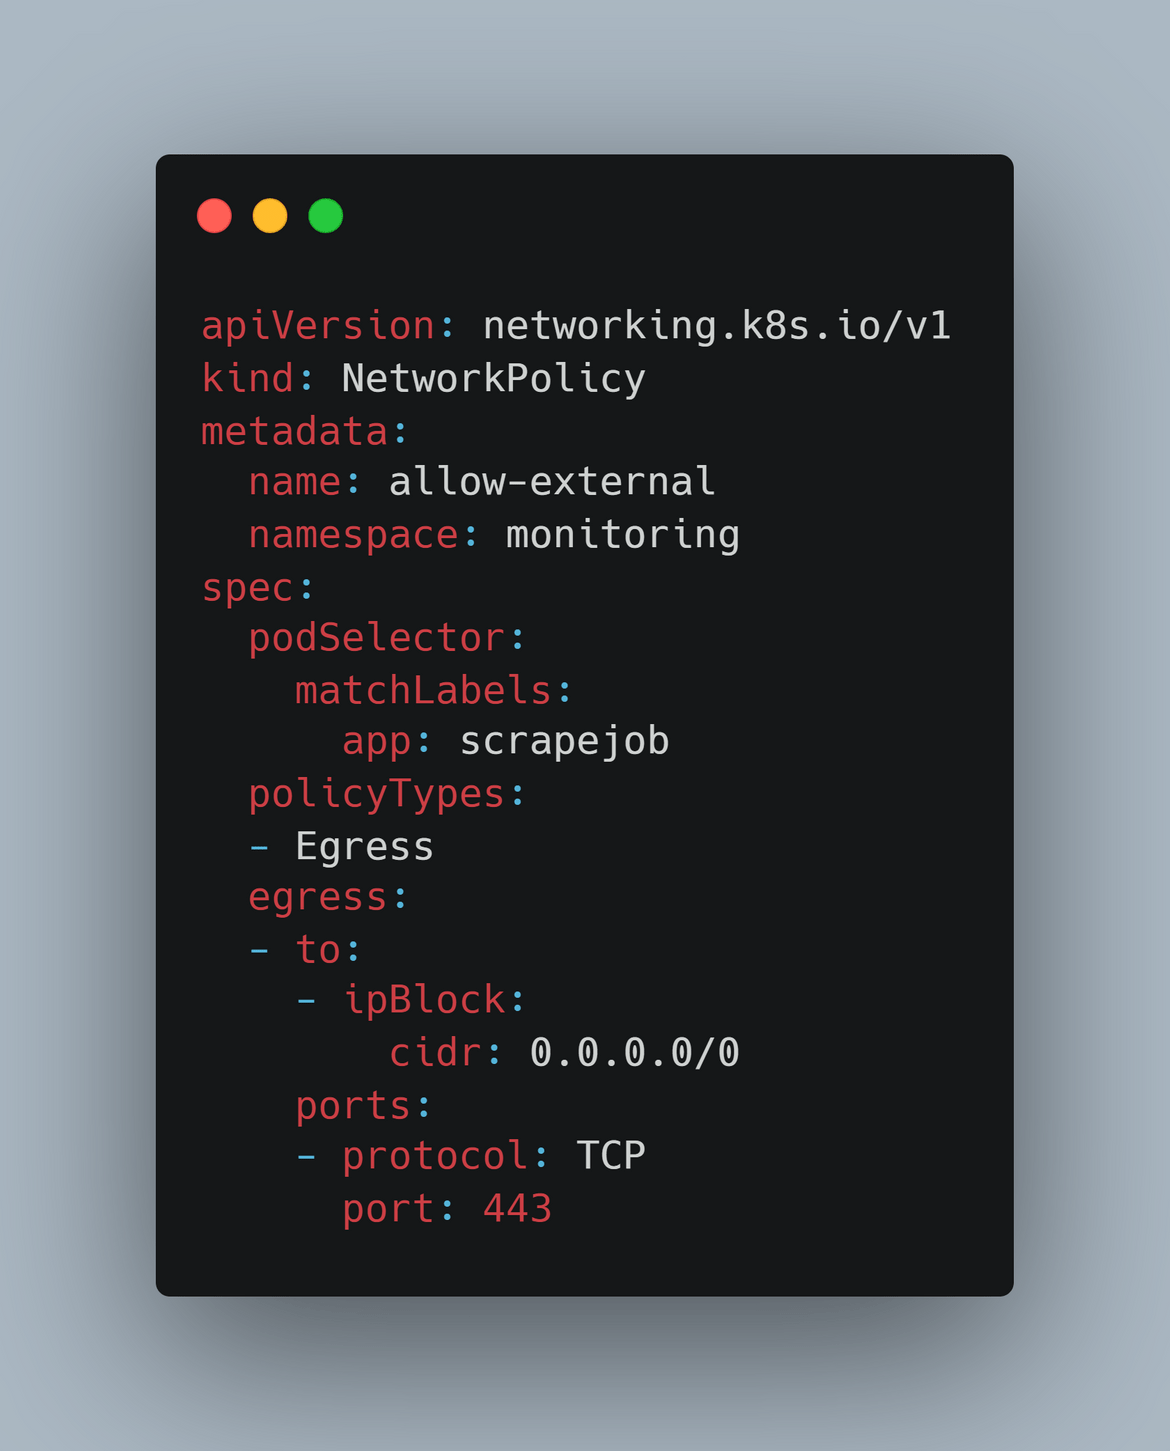
Network Policy to allow traffic:To allow the Cron job to be able to reach the external share price API, here I am defining the network policy to allow the external traffic.
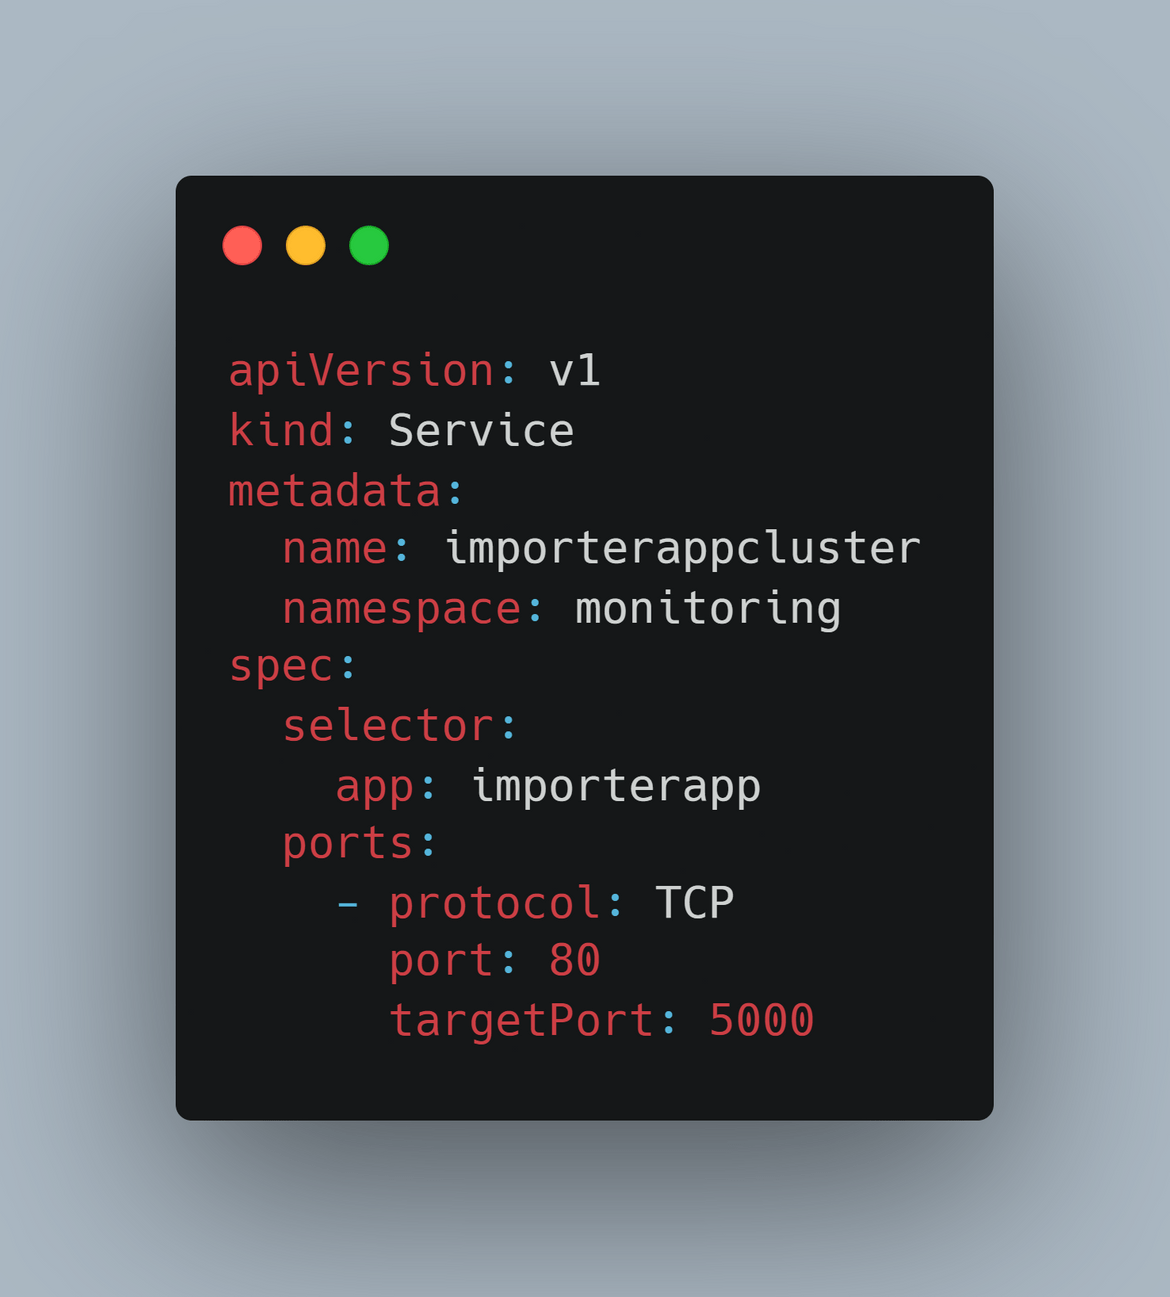
services.yml: Here I am defining the different services to expose the API endpoints for and the Redis endpoint for use by the app. There are few services defined here:
Cluster IP to expose the importer API within cluster:This defines the Cluster IP service to expose the importer API endpoints. Since the API is only accessed within the components like Cron job and the Prometheus instance, there is no publicly available endpoint but only endpoint exposed within the cluster.
Cluster IP for Redis:To be able to access the Redis DB, this defines a cluster IP for Redis endpoint. The importer API accesses the Redis via this Cluster IP endpoint.
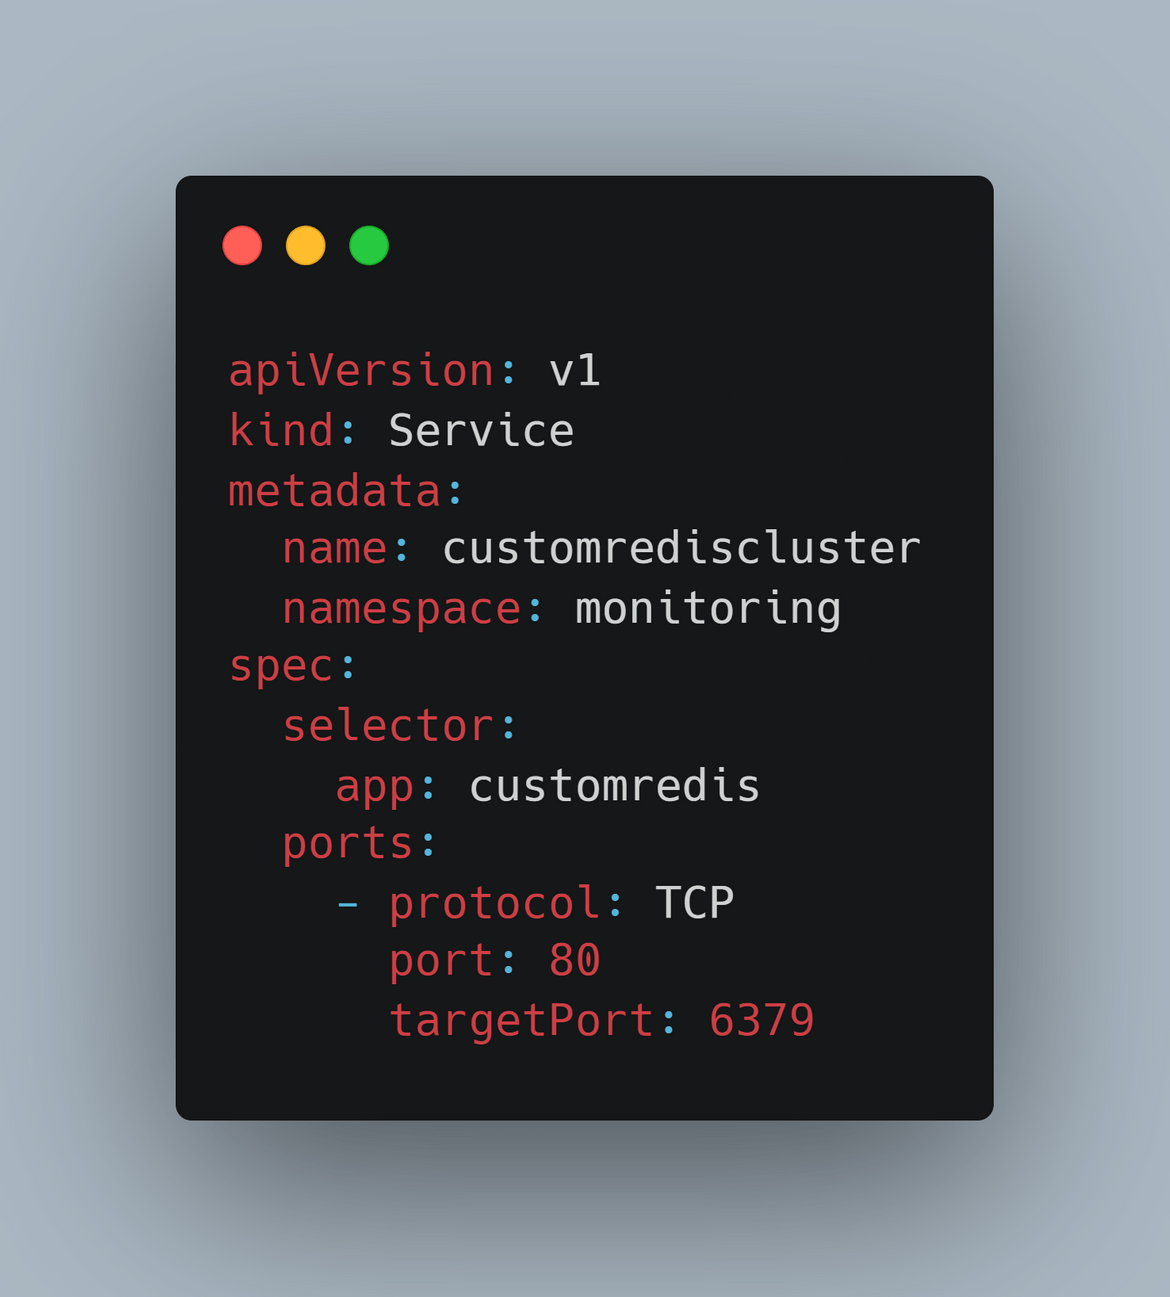
Now lets understand how these are deployed by the pipeline to the EKS cluster.
Pipeline
Now lets dive into the pipeline to deploy the application. The application is deployed using Jenkins. I will go through each of the steps in the Jenkins pipeline. The application has a separate repo and a separate pipeline.
Folder Structure: First let me explain the folder structure in the application repo.
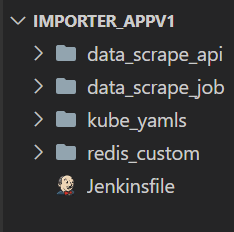
datascrapeapi: This folder contains the codebase for the scraping flask api. This is the api responsible for exposing endpoints for the importer job and the Prometheus instance. The folder contains the code files and the Dockerfile to build the image. It also contains some tests in the tests sub folder which get executed by the pipeline on every pipeline run.
datascrapejob: This folder contains the code for the data scraping cron job. This python application will be running on schedule to get the exchange prices and store in DB. The folder contains the code and the Dockerfile to build the image for deployment.
kubeyamls: This folder contains all YAML files to deploy the application to the EKS cluster. I have already gone through the YAML files in details above
rediscustom: This folder contains the Dockerfile and the custom Redis conf file to build the custom Redis image. The pipeline builds the Redis image from this folder.
Jenkinsfile: Finally this is the Jenkinsfile where the whole pipeline has been defined. This is placed at the root of the directory. I will describe the pipeline below.
Pipeline Parameters: There are some parameters which are passed as environment variables to the pipeline to control different aspects of the pipeline. Below shows all of the parameters passed to the pipeline.
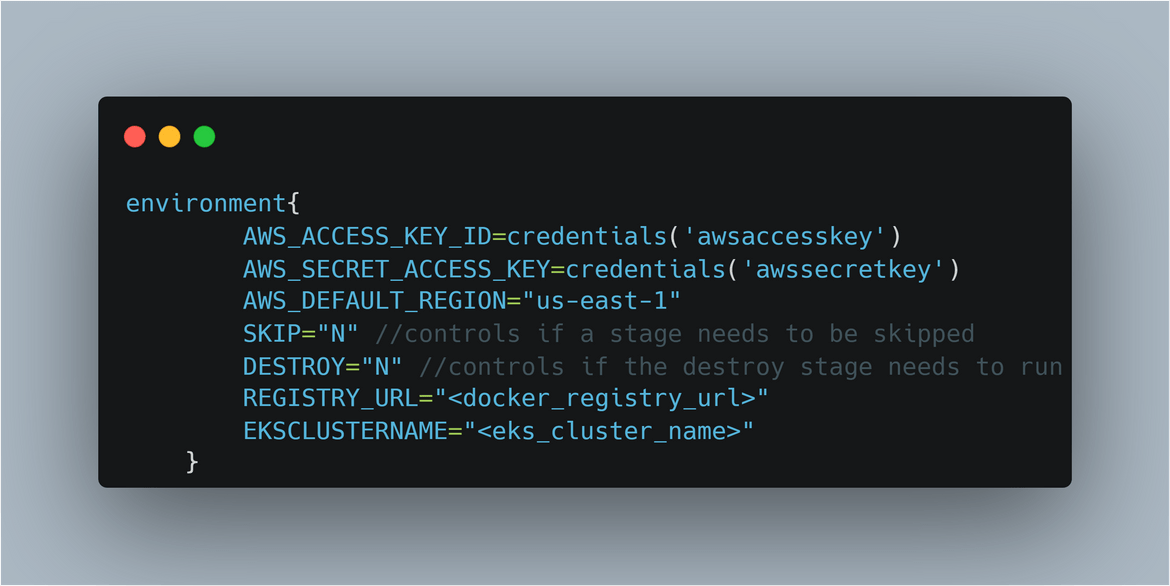
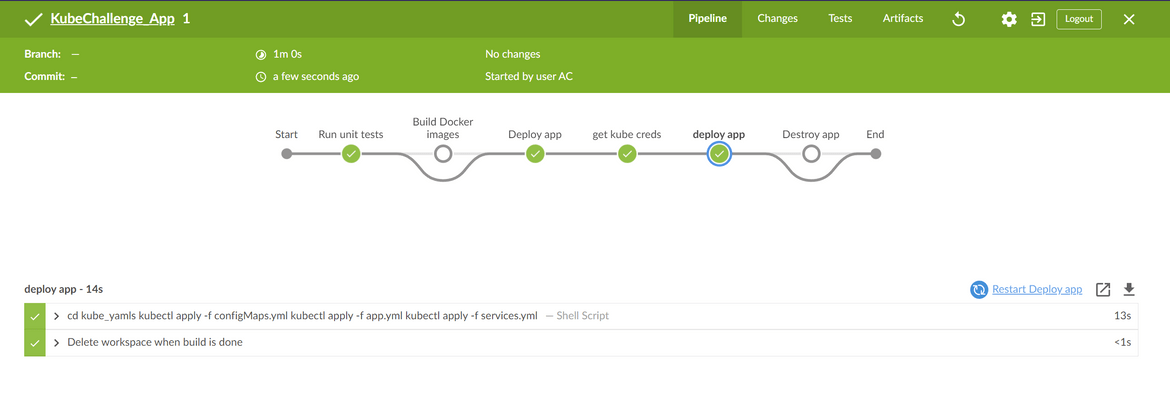
That should explain some basic pipeline related details. Now to come to the pipeline itself, it is a Jenkins pipeline defined in the Jenkinsfile. Below shows each of the steps for the pipeline.
Once the pipeline runs, if all the tests pass successfully, the app components get deployed to the EKS cluster. The Docker images are pushed to the Gitlab container registry.
Testing
Now we have all of the components deployed. So lets do some testing and see how the graphs look on Grafana. First lets see how the API endpoint looks and how does it provide back the. Here I am calling the endpoint which will be called by the Cronjob to pull the price from the public data api and put in the Redis DB
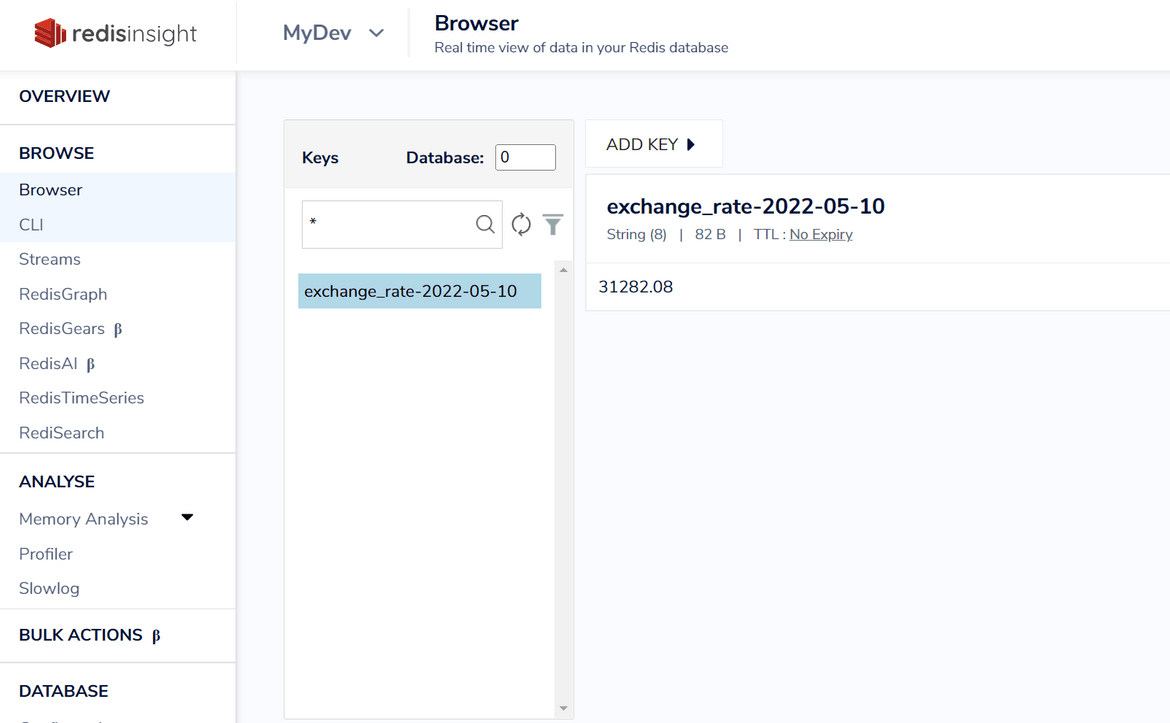
The exchange rate gets stored in the DB. We can log in to the Redis DB instance and view the key added for current date:
Now that we have the data in the Redis DB, lets call the API endpoint which will be called by Prometheus to scrape the data as metric. This is how the data will be presented to Prometheus
Now that we have seen the data format for the metric, lets view this on the actual Prometheus console. The load balancer URL for the Prometheus and the Grafana instances should have been sent as alert to the Slack channel so we can grab the same from there.
Please note, that the Load balancer endpoint has been exposed just for the demo, in my actual script, Prometheus is only exposed as a Cluster IP so only Grafana can access the same. Once I access the Prometheus instance I can see the exchange rate metrics there.
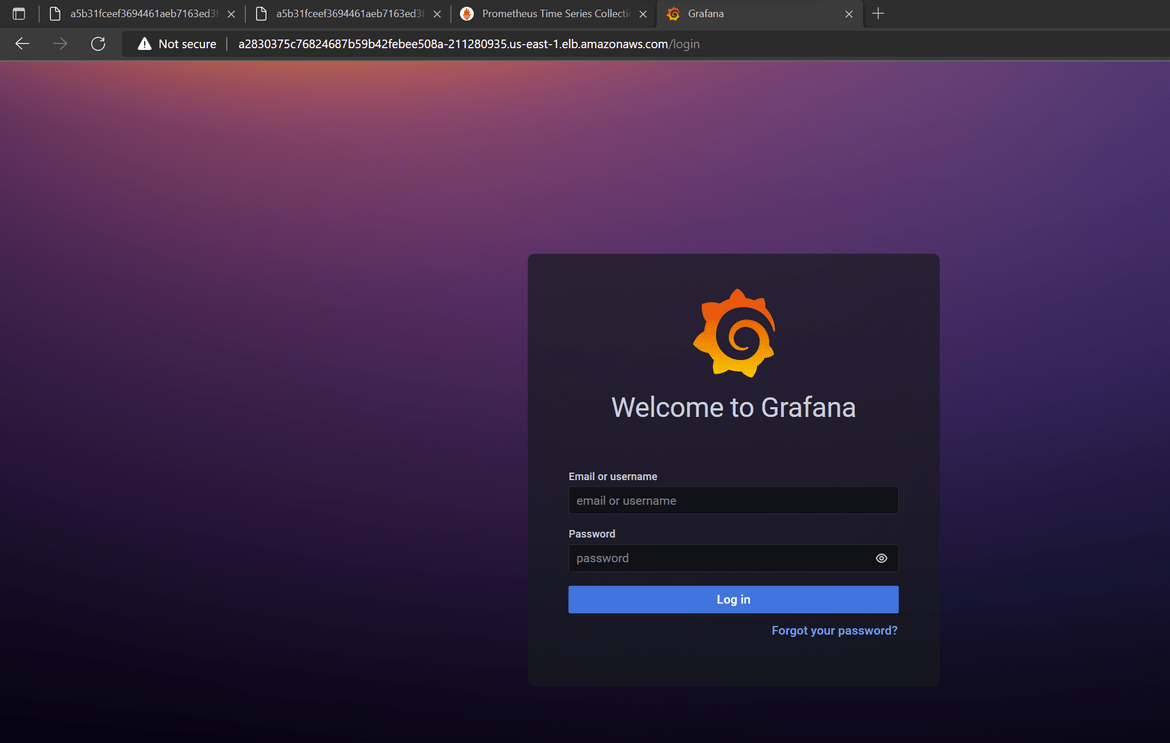
Now lets login to the Grafana instance. Use the username of admin and the password which was passed in the values.yml during infra deployment.
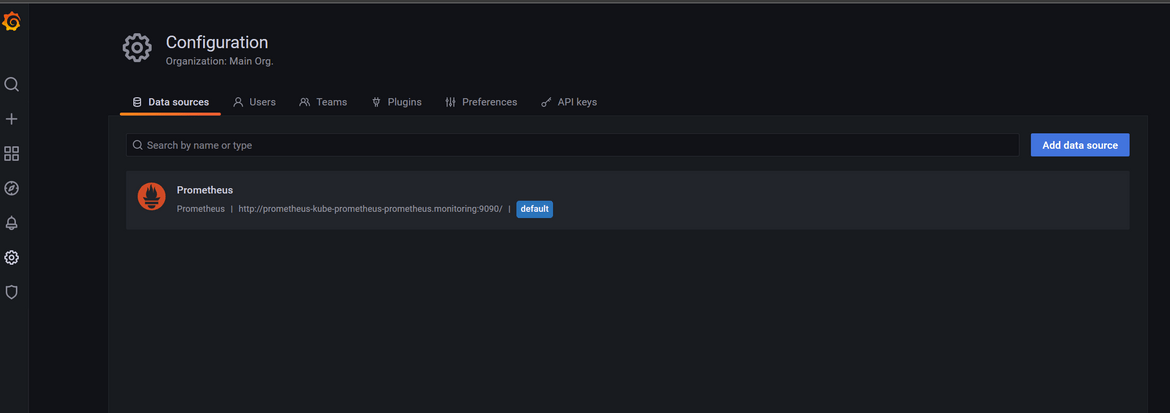
Once in Grafana, we can navigate to the Data sources page and see that Prometheus endpoint has been updated as the source endpoint. This is the Prometheus Cluster IP name:
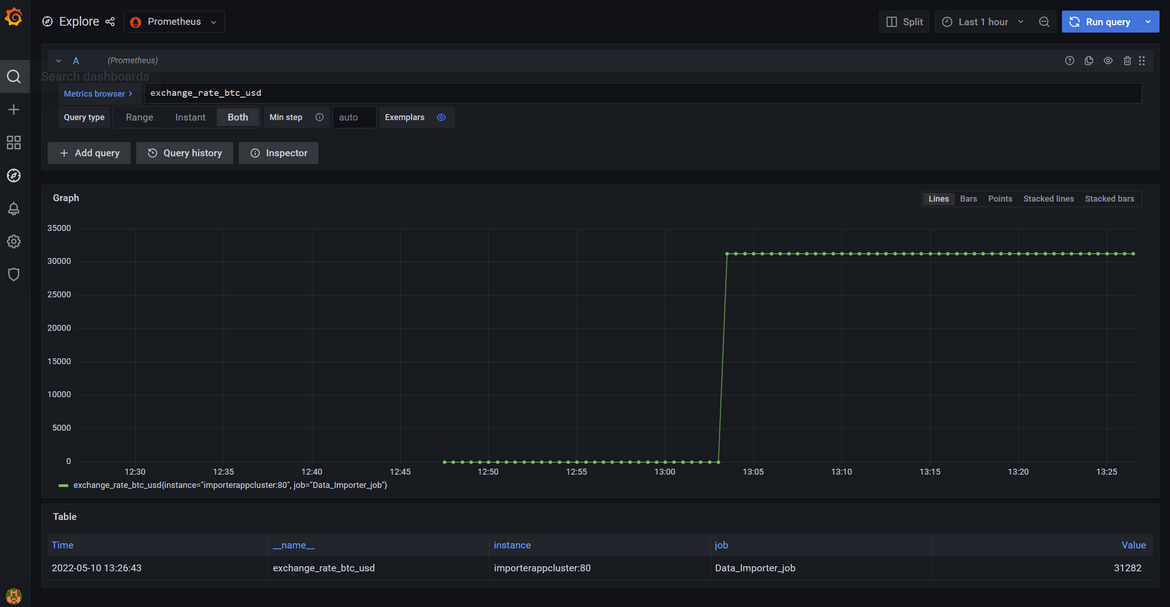
We can explore the Prometheus metric data for the exchange rate within Grafana UI:
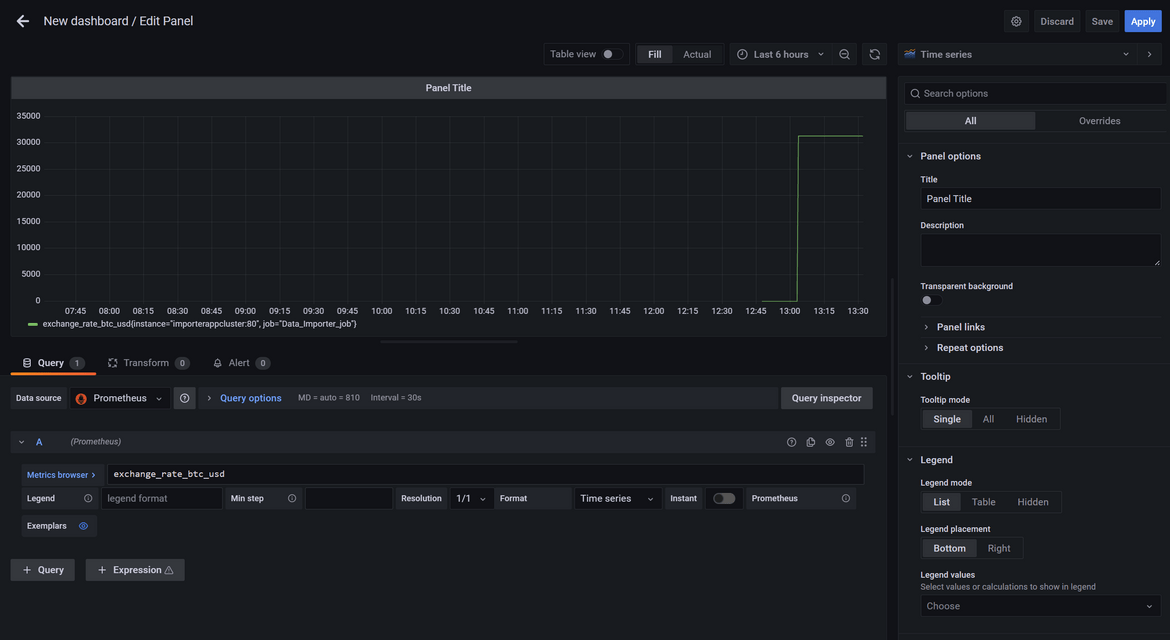
From the Create Dashboard page, lets create a new dashboard with the above exchange metric data. I ran the metric scraping for few times to generate the data for the graph:
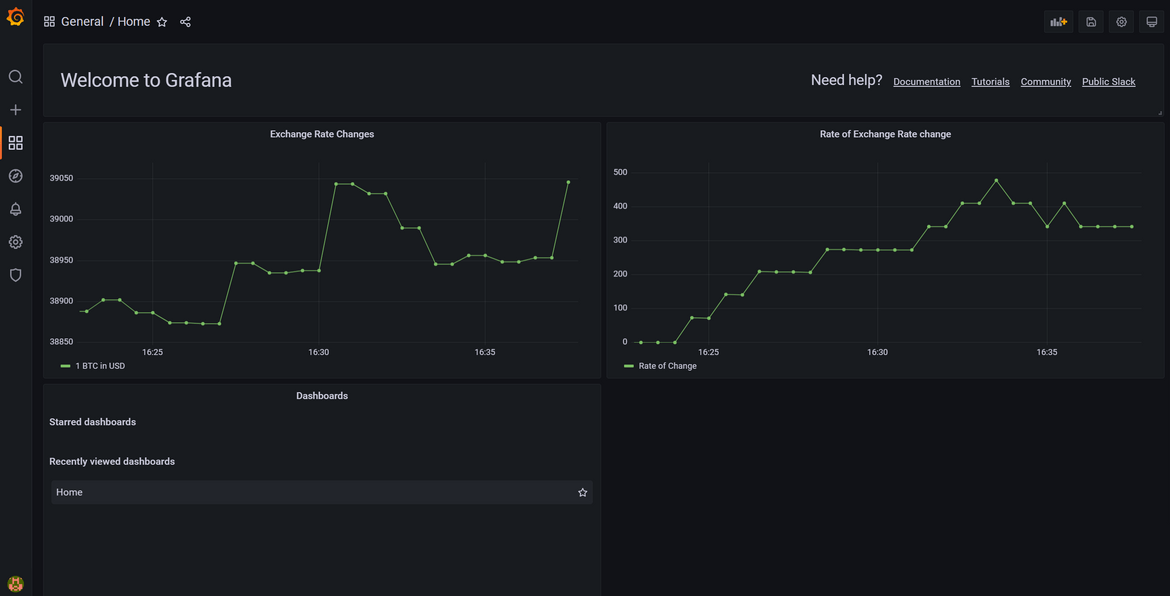
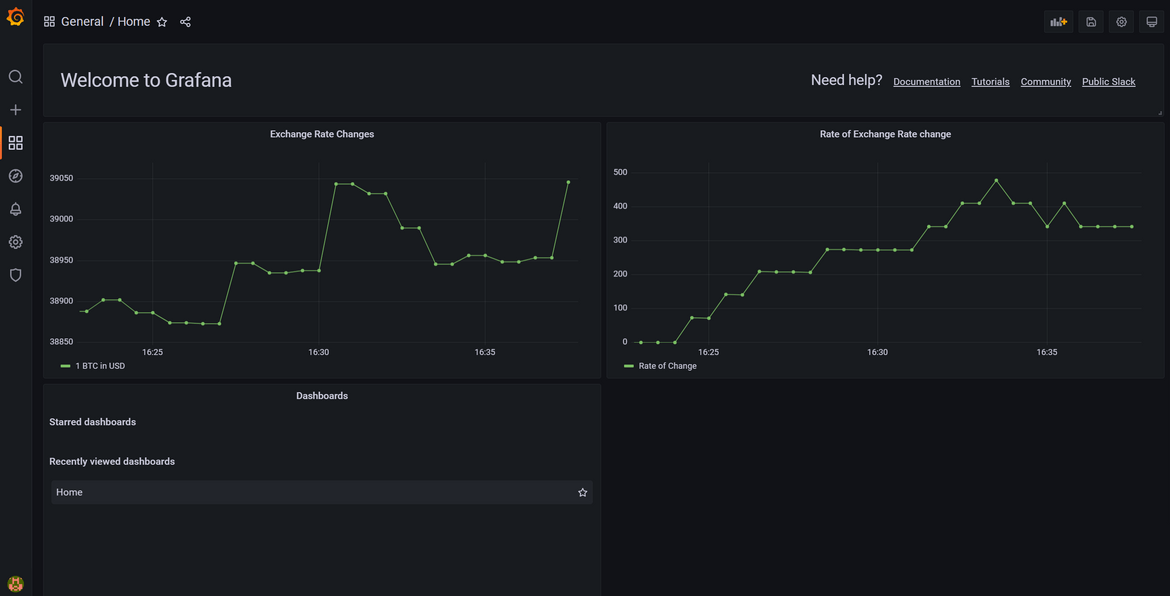
Once the dashboard is created, we can visualize the exchange rate metrics. Here I am visualizing the rate of the exchange rate change.
Improvements
As I finish this challenge, there are few areas which I keep improving about the whole process. Some of the ideas for improvements which I am working on are below and will keep the repo updated with the changes:
- Add a Pod auto auto scaler to the API deployment to have a level of scalability
- For Redis DB, add a persistence so the data is saved
- Add monitoring on the API and the Cron job
- Make the endpoints secure via https
These are some immediate changes I am working on and more will be coming soon.
Conclusion
In this post I explained my approach to the Acloud Guru challenge. Hopefully I was able to explain in detail about how to deploy a data scraping job and visualization workload on a Kubernetes cluster. This should help you on spinning up a similar process of your own. If there are any questions or you see any issues in this, reach out to me from the contact page.
