An Event Driven ETL Process: Use Step Functions, AWS Glue and Lambda to Orchestrate an ETL Process
This post is my solution walkthrough for the Acloud Guru challenge to build an event driven ETL process. The challenge details can be found Here. I really like going through and solving these challenges since these give me a scope to learn so many things which are involved in completing the challenge. In this post I will describe my approach to the challenge and walk through step by step about deploying the solution. Hopefully this will help others get some pointers for the challenge and learn few things.
The GitHub repo for this post can be found Here
About the Challenge
Above I provided the link for the actual challenge itself. But let me explain at high level what the challenge asked for. Below are the precise requirements which the challenge asked for to be completed:
-
An ETL Job: An ETL job has to be built which will run daily on a schedule. The job has to be in a scheduled mode and not a poling mode. The job will perform three tasks:
- Extract: Extract the data from a Github repo
- Transform: Clean and filter the raw data. Also perform a join with another dataset to get a wholistic dataset.
- Load: Load the data to a data table. The table can be any database table
- Notifications: The job should notify interested parties upon completion. The notification should specify regarding the status of the job run and data counts.
- Error Handling: The job should be able to handle error scenarios and on failure whould handle the failures on subsequent job runs. Notification should be sent out accordingly.
- IAAC and Deployment: The whole infrastructure should be created as a code using any of the available frameworks. Whole deployment needs to be automated and the source code need to be source controlled.
- Dashboard: Finally an analytics dashboard need to be developed and displayed showing visualizations based on the data loaded to the table.
Hopefully I was able to outline the high level requirements for the challenge. Next I will go through my approach of meeting each of these requirements.
Overall Process Flow
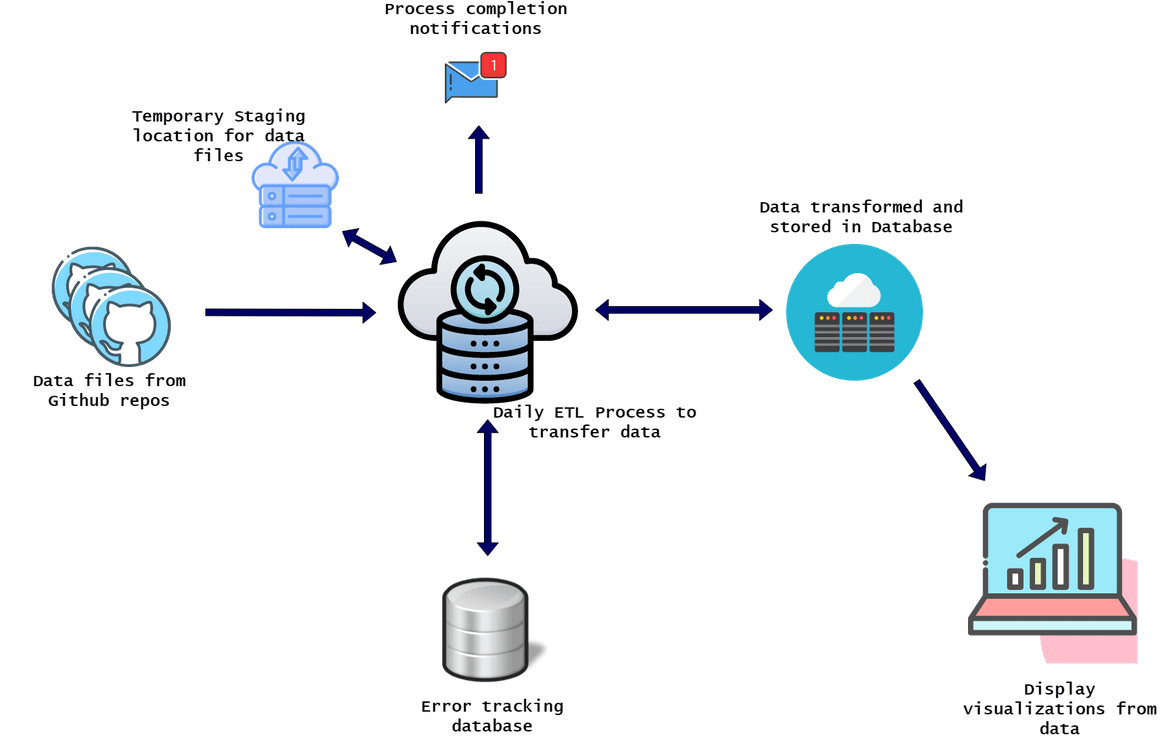
Let me go through an overall process flow for my solution. Below diagram shows a high level flow for the whole end to end data process.
Let me explain each step:
- The source for the data files are 2 Github repositories. The ETL process reads the files from these repos
- The ETL process runs on a schedule very day. Once triggered, the process reads the files the repositories
- The process performs these tasks on the data files:
- Join the files
- Transform the files to fix data formats
- Filter the dataset to filter out only needed data
- The modified data file is uploaded to a temporary staging location. This will be source for the data transfer job
- The data transfer job part of the ETL process, reads the file from the above staging location and loads the data to a database
- The transfers process also tracks errors on a separate database to track which records failed and retry on the next run
- After the process compltes, it sends out a notification to interested parties. The notification shows the status of the job and info about records updated or failed
- The analytics dashboard is built to show visualizations with the database as a source. The dashboard is refreshed after each day off data load
Tech Architecture and Details
Now that you have a high level idea about the process. Lets dive into the tech details. This is what I will cover here:
- Overall Architecture: Here I will cover the overall end to end architecture of the whole process
- Components: I will go through each component in detail and how each part of the process in handled
Full System Architecture
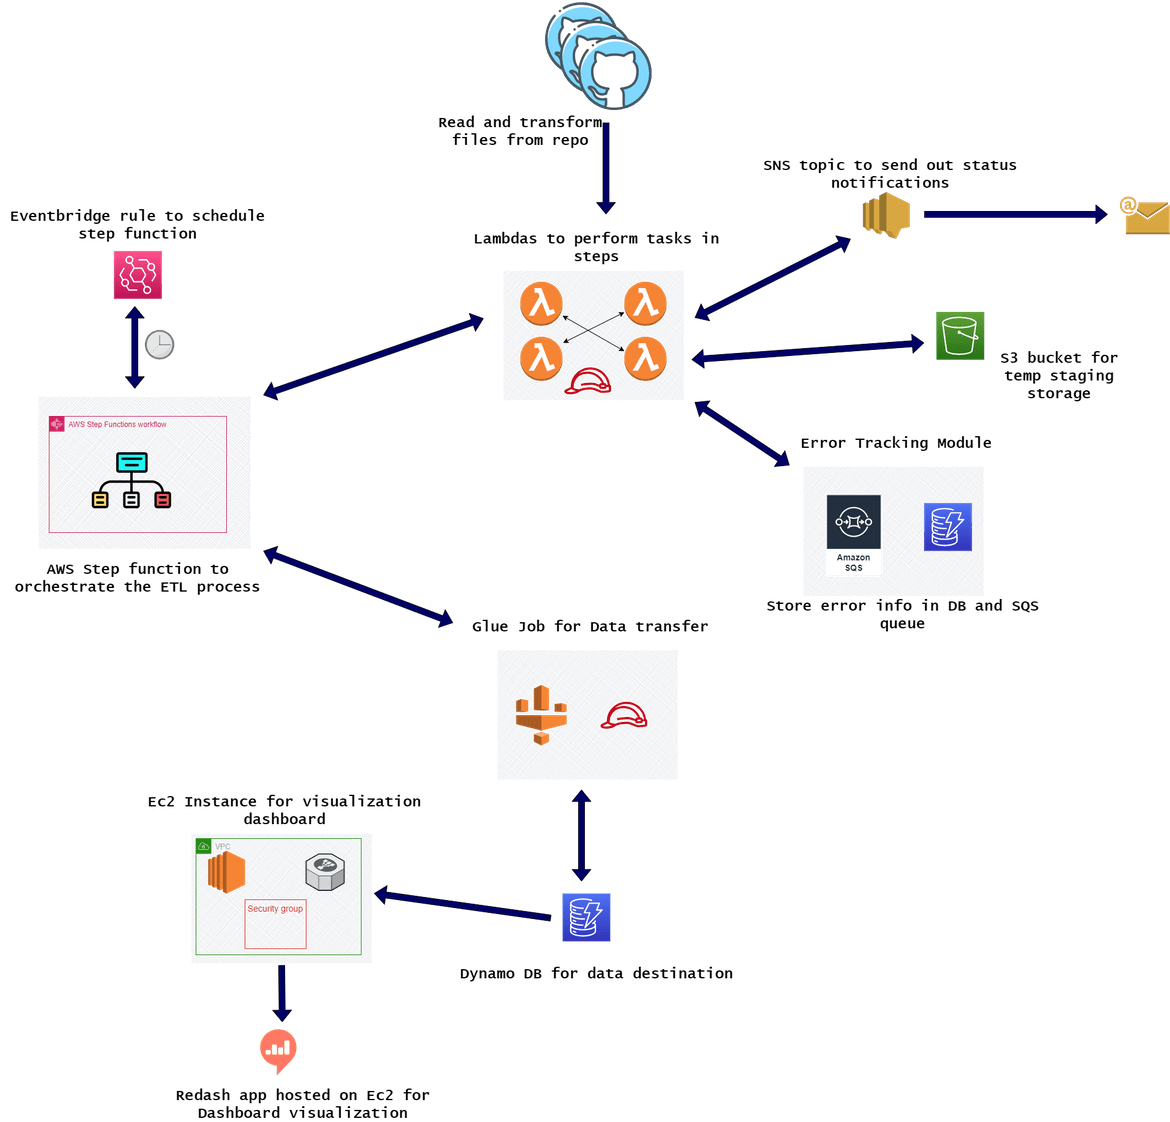
First let me explain the whole process architecture. This image shows all the components involved in the end to end process:
Let me explain each:
-
Lambda Functions: All of the tasks are performed by various Lambda functions. These are the tasks handled by different Lambda functions:
- Read from Github repo, transform files and store in S3 bucket
- Track and store error information in DynamoDB and SQS queue
- Track Glue job status and store error info
- Send out process status notification
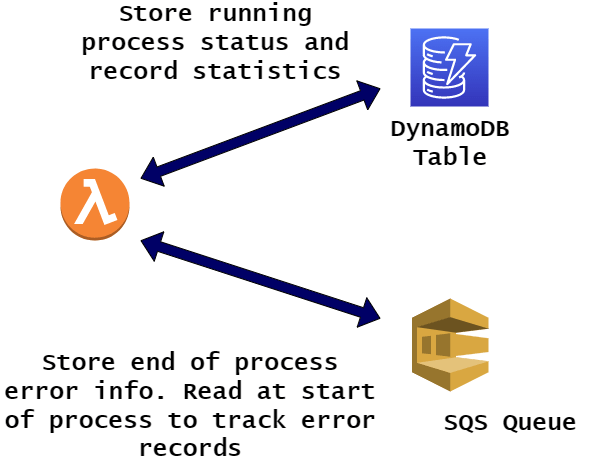
- Error Tracking Module: This consists of a DynamoDB table and 1 SQS queue. Running job status is stored in the DynamoDB and deleted at end of precess completion. Error info is stored in the SQS queue to be read by the job run next day.
- Glue Job for data transfer: A glue job is setup which reads the data file from the S3 bucket and loads the data to the DynamoDB.
- Instance for Dashboard and Visualization: For the visualization dashboard, Redash app is being hosted on an EC2 instance. To expose the dashboard endpoint, the instance is put behind a load balancer. From the Redash app, dashboard is developed with the DynamoDB as source. You can read more about Redash Here
- AWS Step functions: All of the above components are orchestrated as a whole ETL process using AWS step function. A state machine is created to coordiante different tasks between the Lambdas and the Glue process.
System Components
Now let me go through each of the above components in detail.
Lambda Functions
There are 12 Lambda functions involved in the whole process. Each Lambda is handling a specific task. These are high level what each Lambda is doing:
- Lambda 1: Reads from source GIT repo, transforms file and loads to S3 bucket
- Lambda 2: Count and track DynamoDB records to track running load status and errored records info
- Lambda 3, 5, 6, 7: Track running process status before the Glue Job runs. These lambdas stores initial info before running Glue job
- Lambda 8, 9, 10, 11: Track and store data load status after the Glue job. For errors, store the error info in SQS queue
- Lambda 12: Read all the running process status and error info, then send out email notification accordingly to registered parties. It will send load statistics too in the email.
Error Tracking Module
All errors and the running process status is tracked in two services. Below diagram will show the process
Glue Job for data Transfer
A Glue job is setup to transfer the data file from S3 and load as records on the DynamoDB. Below diagram shows the process for Glue Job:
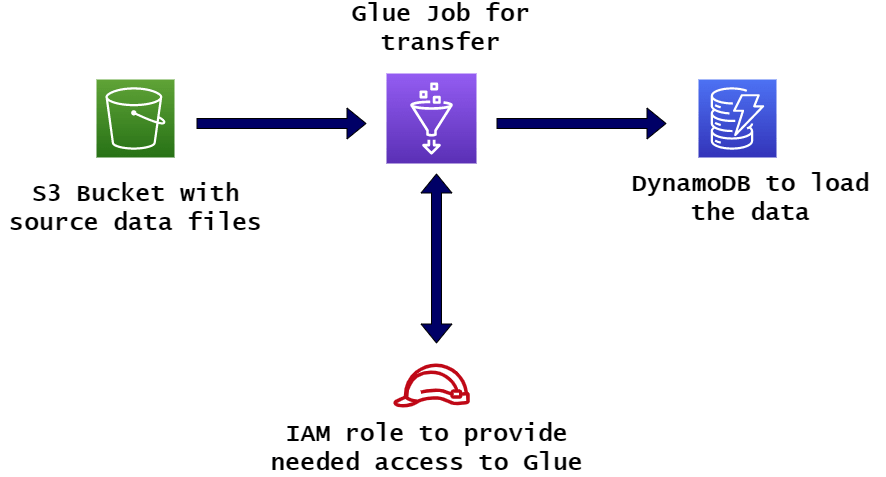
These are the steps handled by the Job:
- Read source files from S3 bucket
- Transform data types to match destination DB columns
- Load data to DynamoDB
AWS Step Function
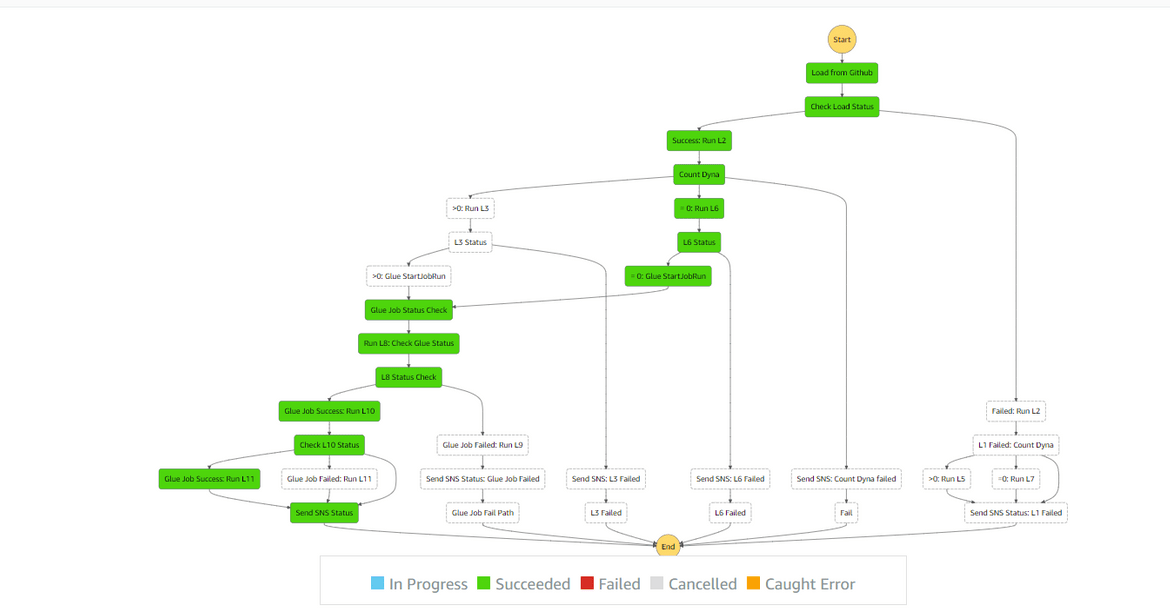
The whole process is orchestrated by a State machine created using AWS step function. I wont go into detail of all steps of the state machine, but this is the flow handled by the state machine:
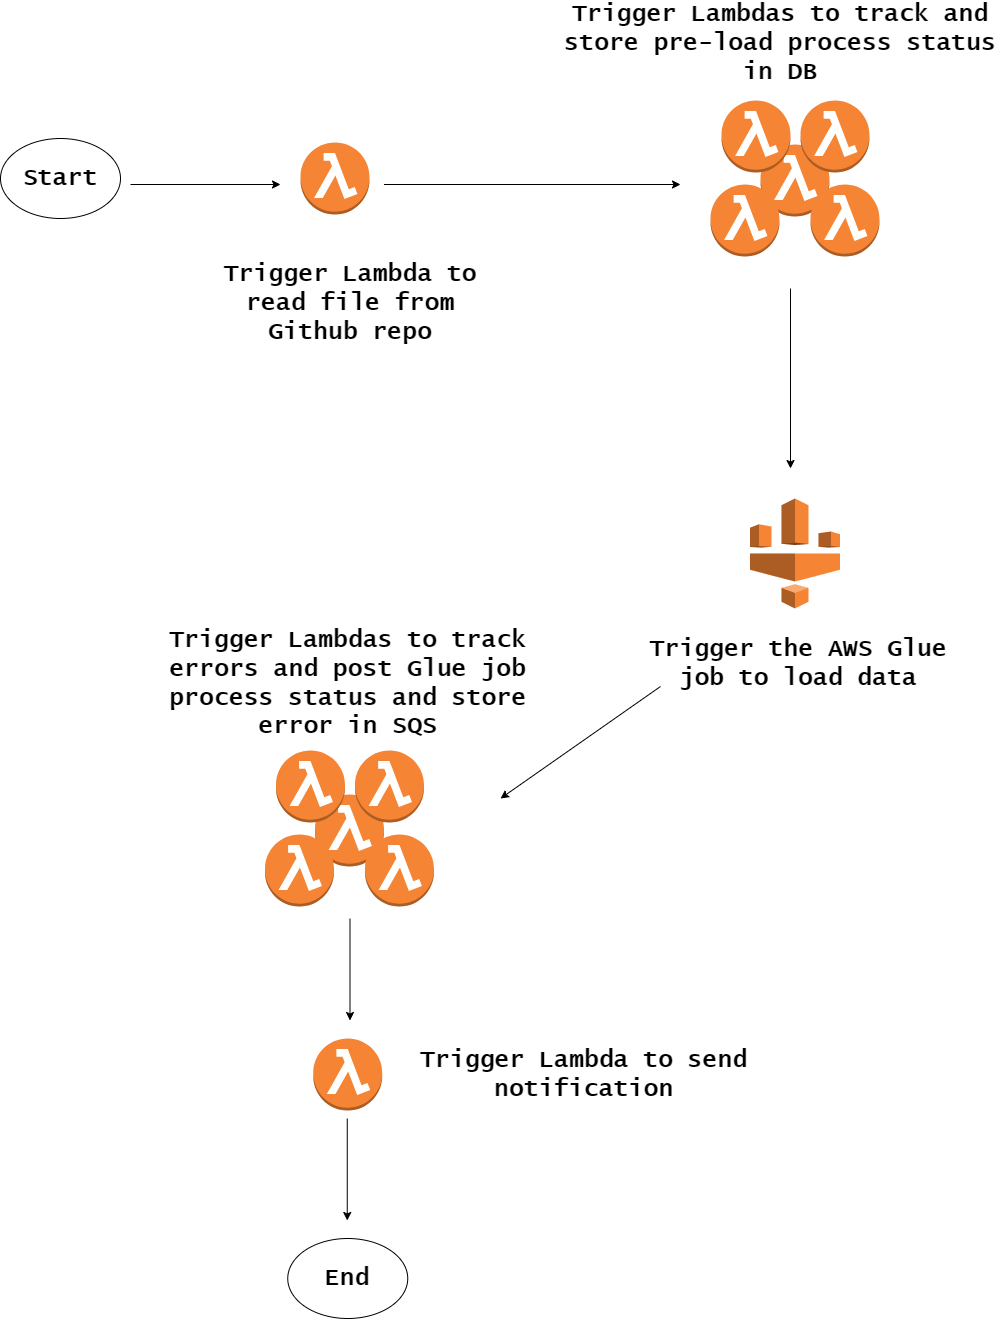
These are the steps which are handled in the state machine:
- Once triggered, run the lambda to read the Github repo and load to S3 bucket
- Based on the status of above, triggere multiple Lambdas in sequence to track pre-glue job status and store the info in DynamoDB
- Trigger the Glue Job
- Once the job is done, trigger next set of Lambdas in sequence based on various status of the job and records loaded. These Lambdas will store the error info(if any) to the SQS queue
- Trigger the Lambda to send SNS notification and send out final email status
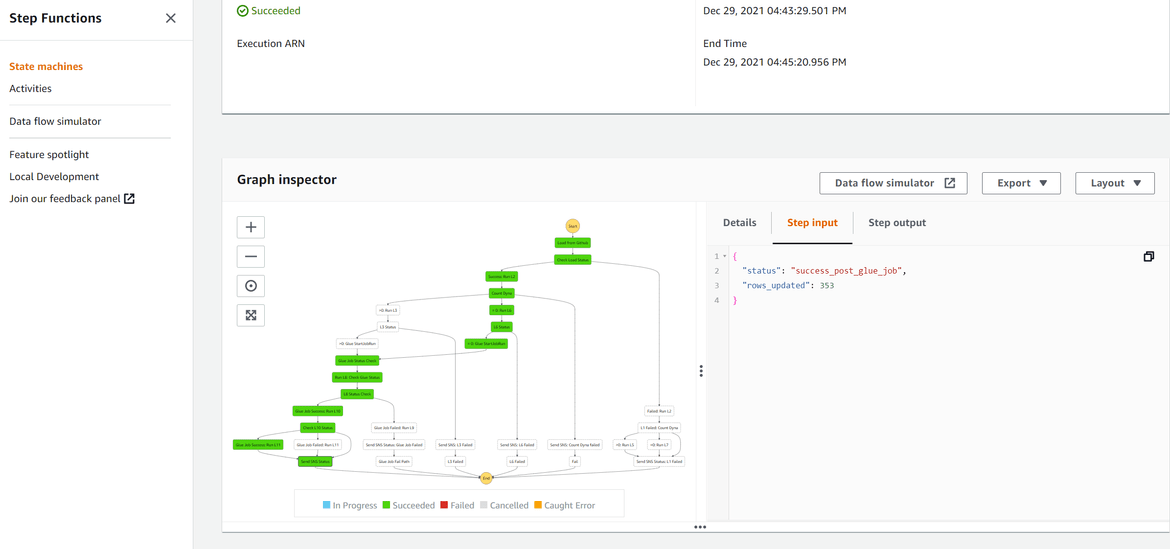
Below is a screenshot of the actual step function:
Instance for Dashboard and Visualization
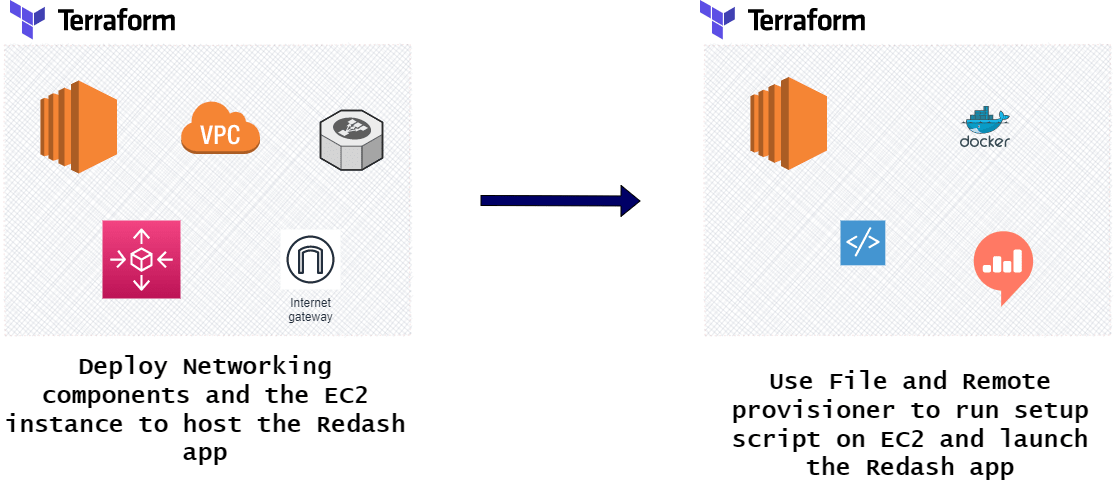
For the visualization, Redash app is deployed to an EC2 instance. Along with the EC2 instance the networking components are also deployed. Below is the full architecture for the Dashboard deployment. The Redash app is deployed as a Docker service on the EC2 instance using a setup script which is executed when the instance is launched. The setup instructions can be found Here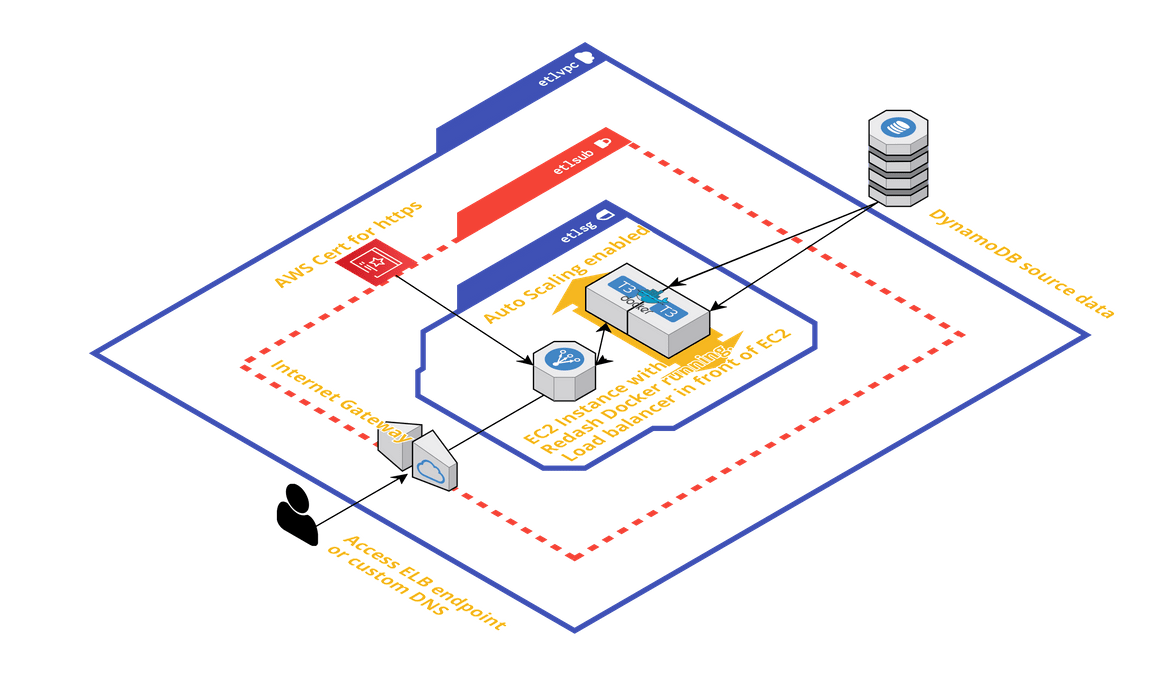
That completes all of the components of the process. Now lets move to deploying the process using Terraform and Jenkins.
Deploying the Solution
The whole solution is deployed using Terraform executed by a Jenkins pipeline. In this section I will go through each of the main components which are deployed through the pipeline.
Folder Structure
Let me first explain the repo and folder structure I have used for the project. There are two repositories involved for this:
- Infrastructure repository: For all infra related components
- Code repository: For all application codes(Lambda)
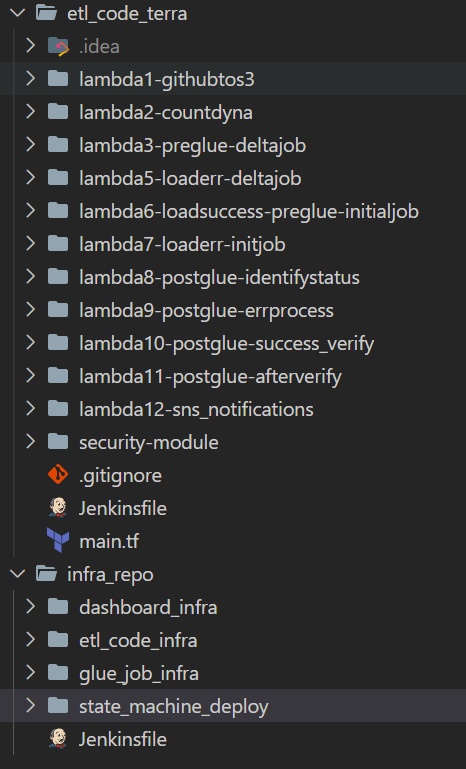
Here is the folder structure for both of the repo:
etlcodeterra
This is the repo for application codes. This contains multiple folders for all of the multiple Lambda functions. Each of the folders contain the respective module codes to deploy the Lambda functions using Terraform. The ‘security-module’ folder contains Terraform module to deploy the IAM roles needed by the Lambdas. All of these are called as modules in main.tf file to deploy each of the component as a Terraform module. The Jenkinsfile contain the pipeline code to handle the whole deployment.
infra_repo
This is the repo for infra components. Different infrastructure components are defined in separate folders in this repo. Let me go through each
- etlcodeinfra: All the infra components needed to run the etl code. This will deploy the source S3 bucket, Destination DynamoDB table, SQS queues and the required IAM roles
- gluejobinfra: All the infra components needed for the Glue job. This will deploy the Glue job itself and the SNS topic for sending notifications
- statemachinedeploy: This contains the module to deploy the AWS step function and the IAM role needed
- dashboard_infra: This contains the Terraform scripts to deploy the whole infrastructure needed to host the Redash dashboard for visualization
Main Components
Let me explain a bit about how some of the main components of the process are deployed. The main components which I will go through are:
- Glue Job
- Lambdas
- Step Function
- Visualization Dashboard and infrastructure
Glue Job
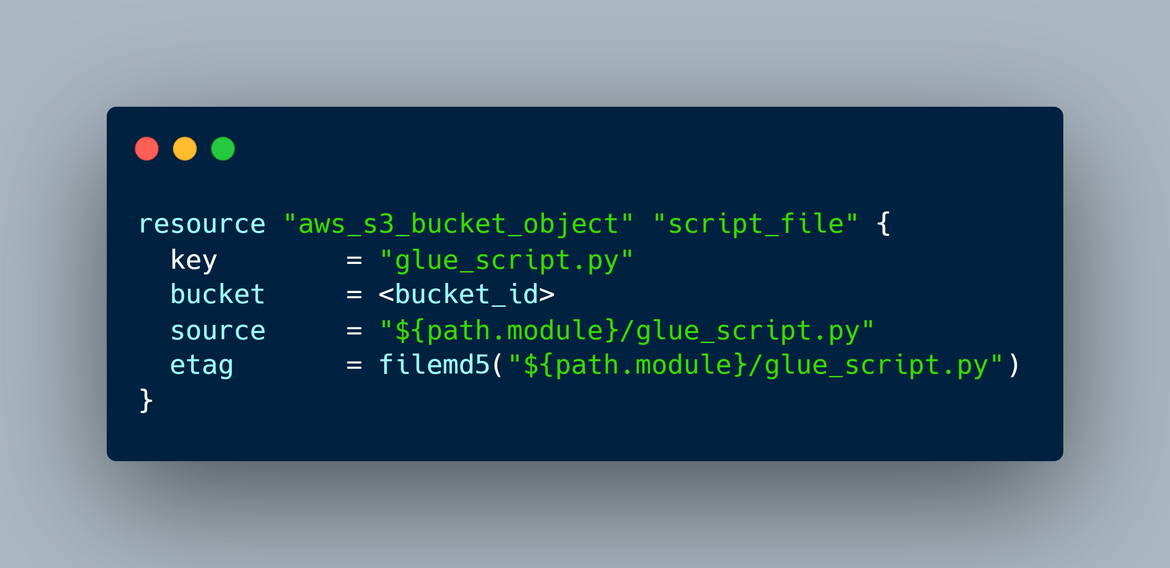
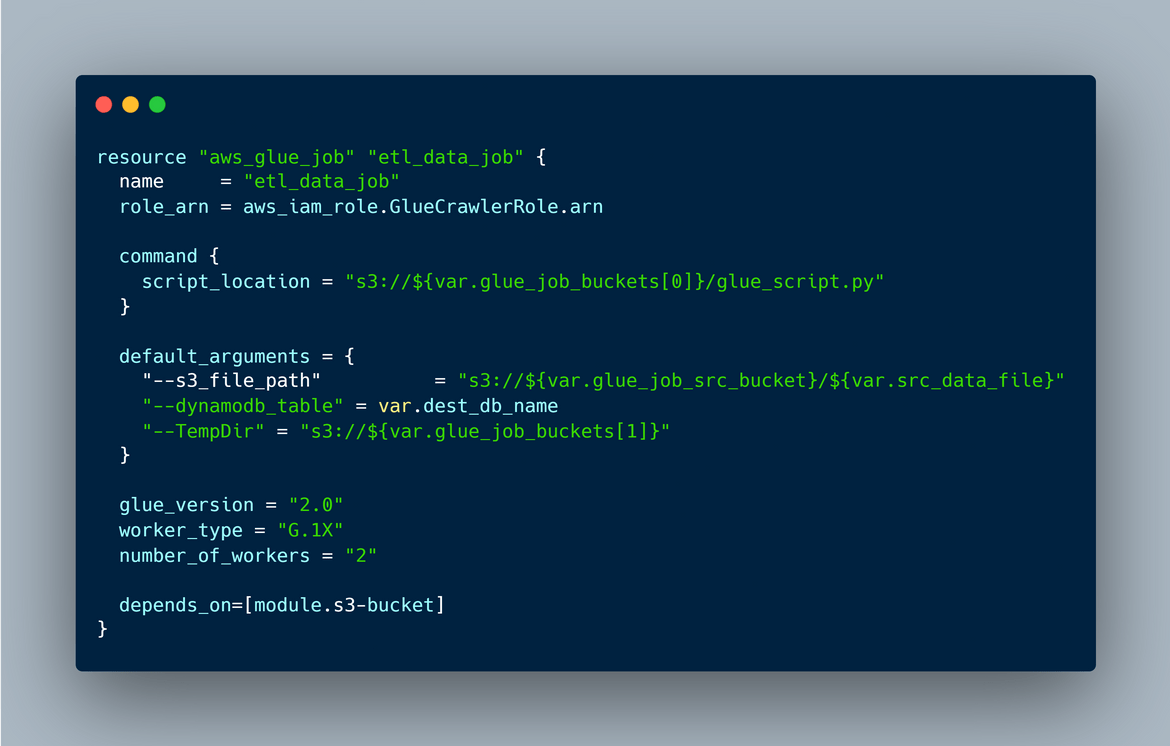
The Glue job is deployed from a job script file which is written to do the data transfer. The script file is in the file named ‘glue_script.py’. In the Terraform script this script file is loaded into an S3 bucket and the S3 bucket is passed as parameter when deploying the Glue Job. Here are the sections from the Terraform script:
Load script file to S3
Glue Job
On a side note you can also create the Glue job manually from AWS console. Some high level steps to do that:
- Navigate to AWS Glue service on AWS Console and click on Jobs. Then click on create job
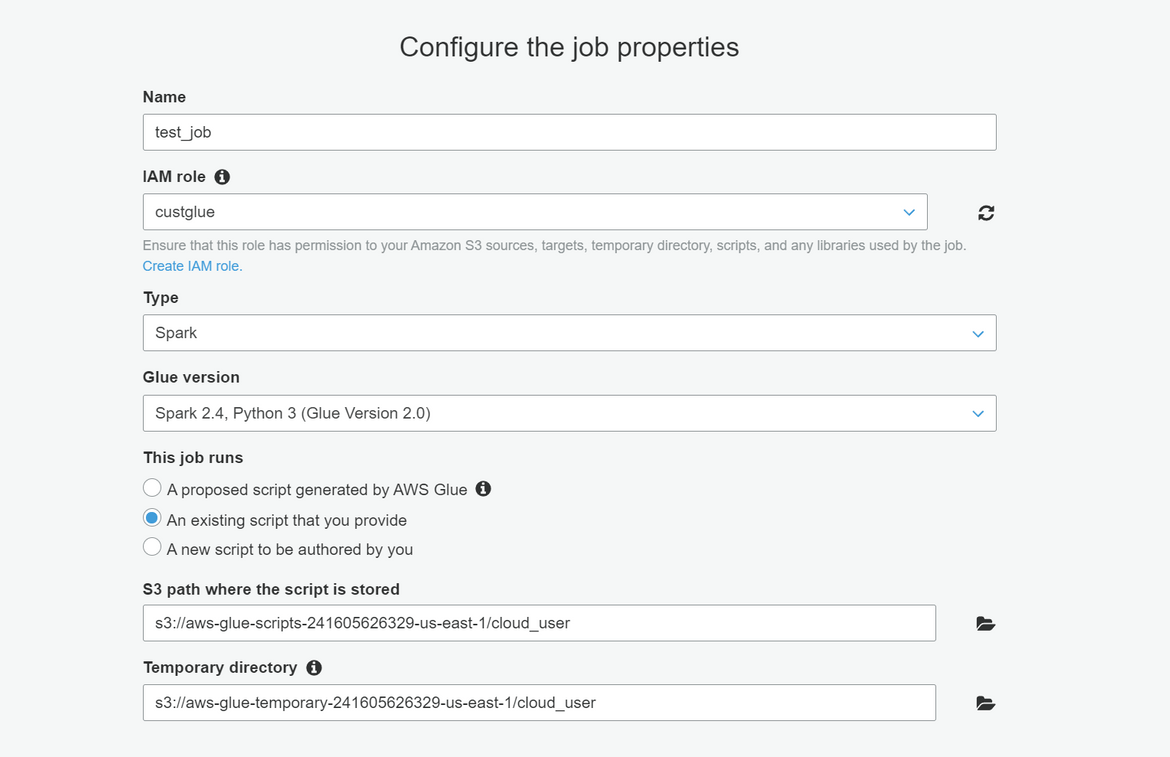
- Enter all the details as above. Select the script location as shown above
- Save the job and you should have the Glue job saved
- The job can be tested by running the job
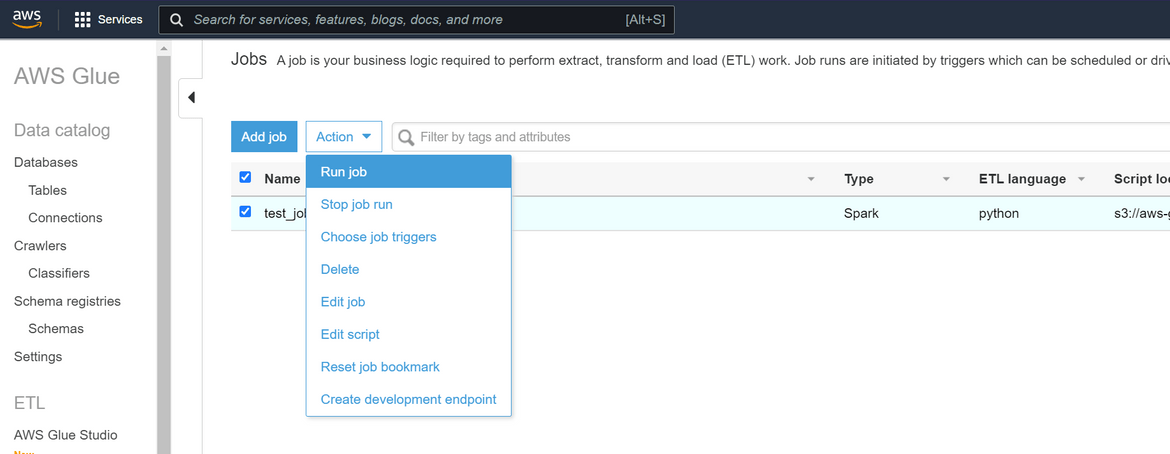
Lambdas
Multiple Lambdas are deployed using the terraform script. Each Lambda is defined as a separate module and called by the main.tf file. This is what is handled in the module:
- Upload the code zip file along with dependencies to the S3 bucket
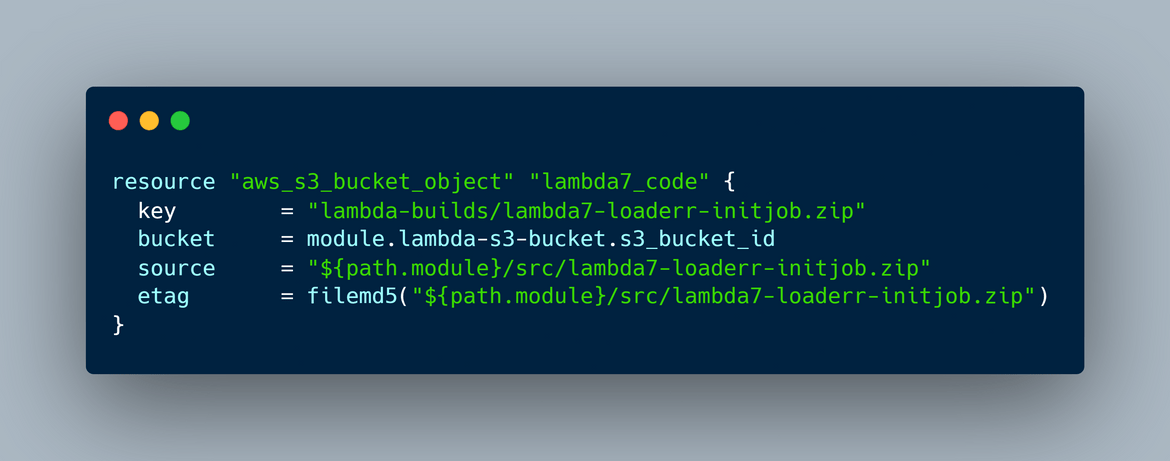
- Deploy the Lambda from the S3 bucket as source
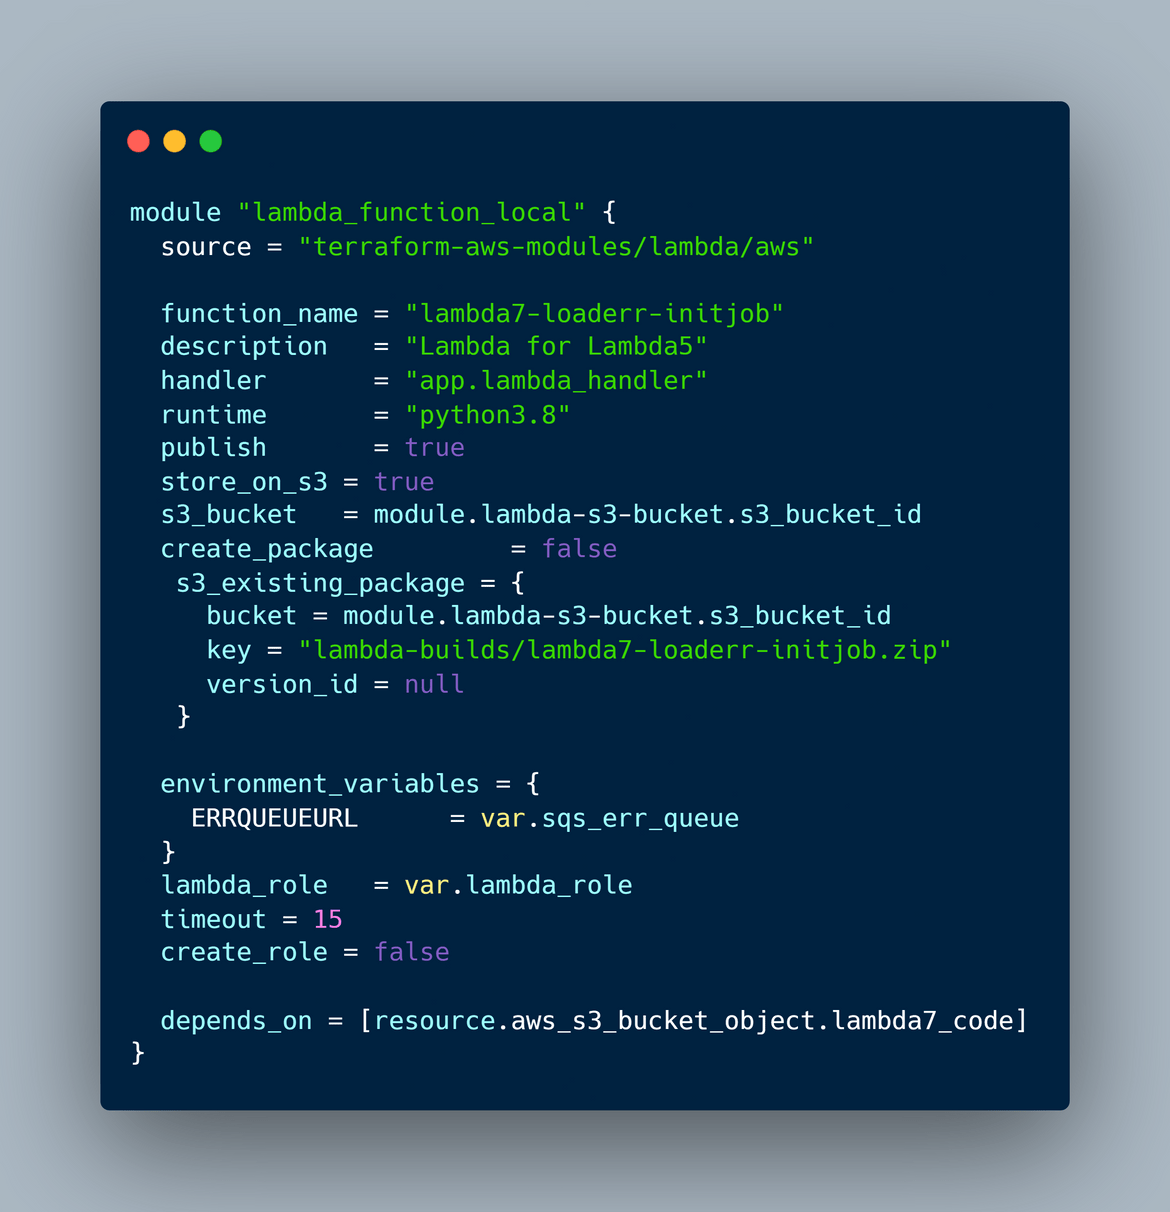
Step Function
The Step function state machine is deployed using the terraform script. The state machine is included into the Terraform script and written using Amazon state language.
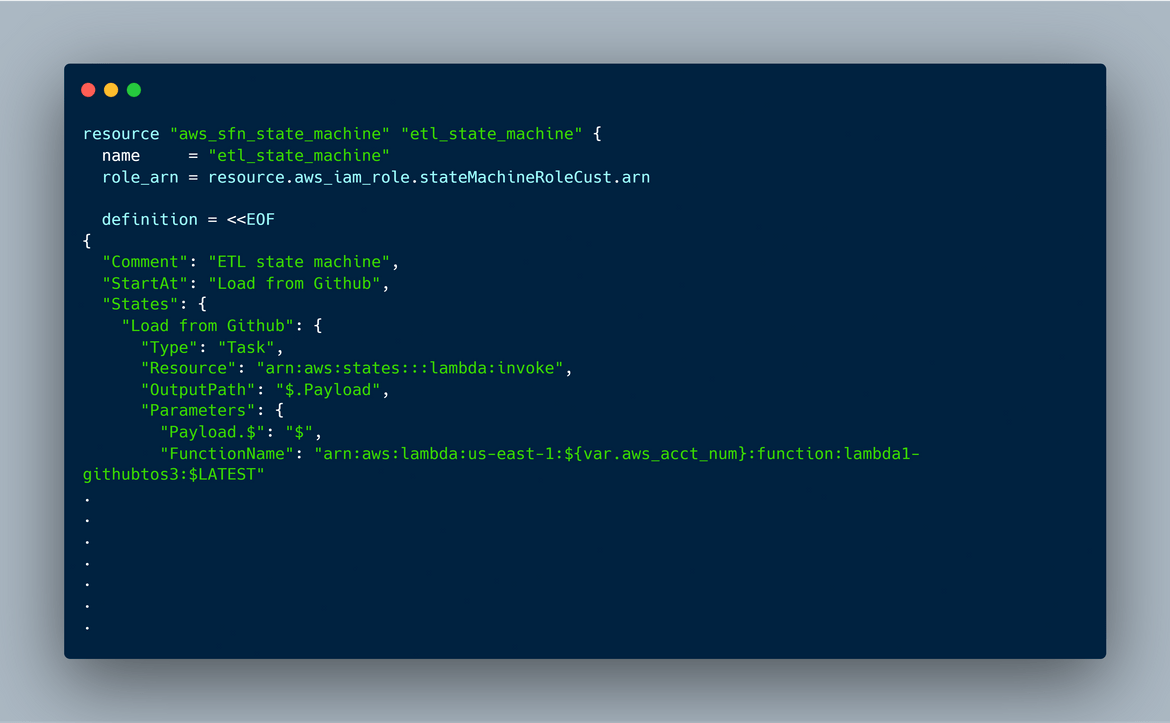
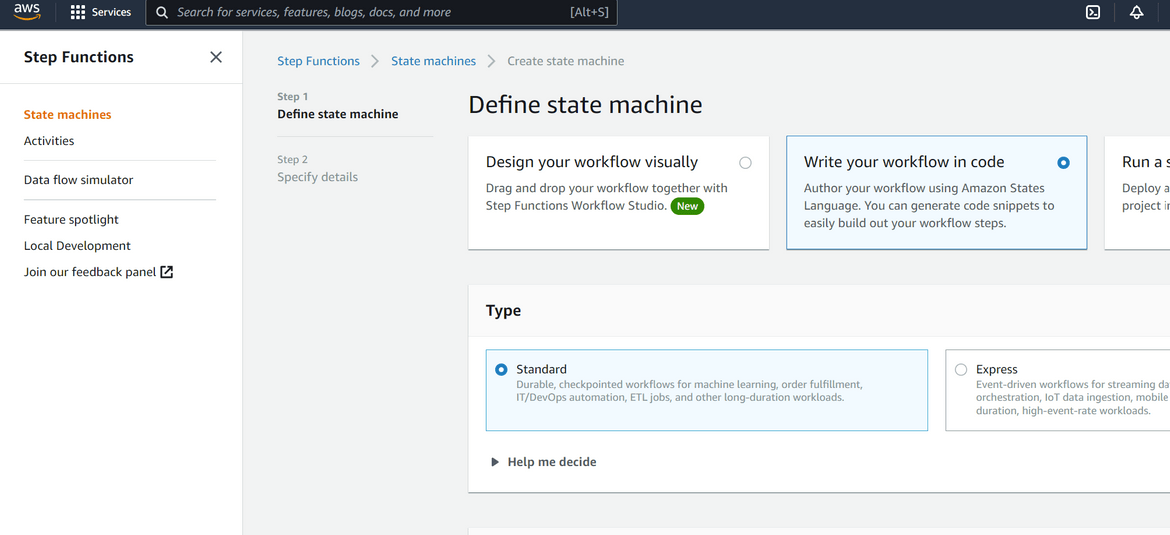
The step function can also be created from the console if preferred. There are two ways it can be created from console.
Using Code: Login to console and navigate to Step Function. Click Create Step machine to create a new one. Select ‘Write your workflow in code’ option
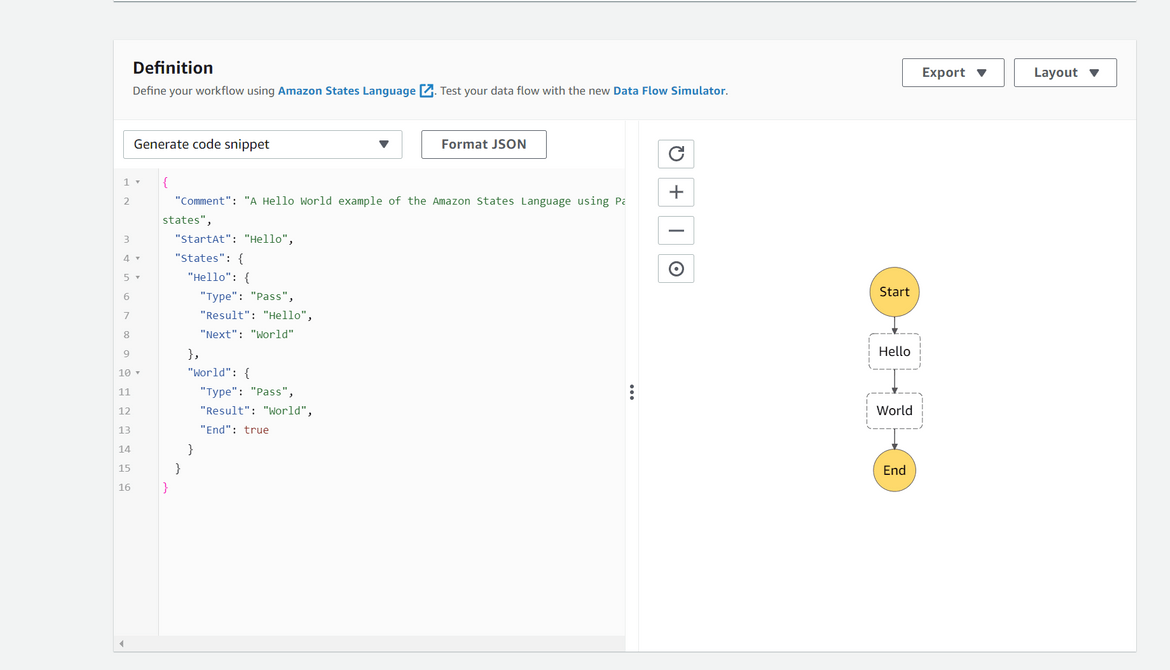
Paste the code in the editor. That will visualize the workflow
In next step select the role and save the state machine. That will create the State machine.
It can be tested by executing the state machine in the next screen.
Using Visual editor: This is a new AWS feature. On the first step of creating State machine, select the Visual option and it will open the workflow visual editor
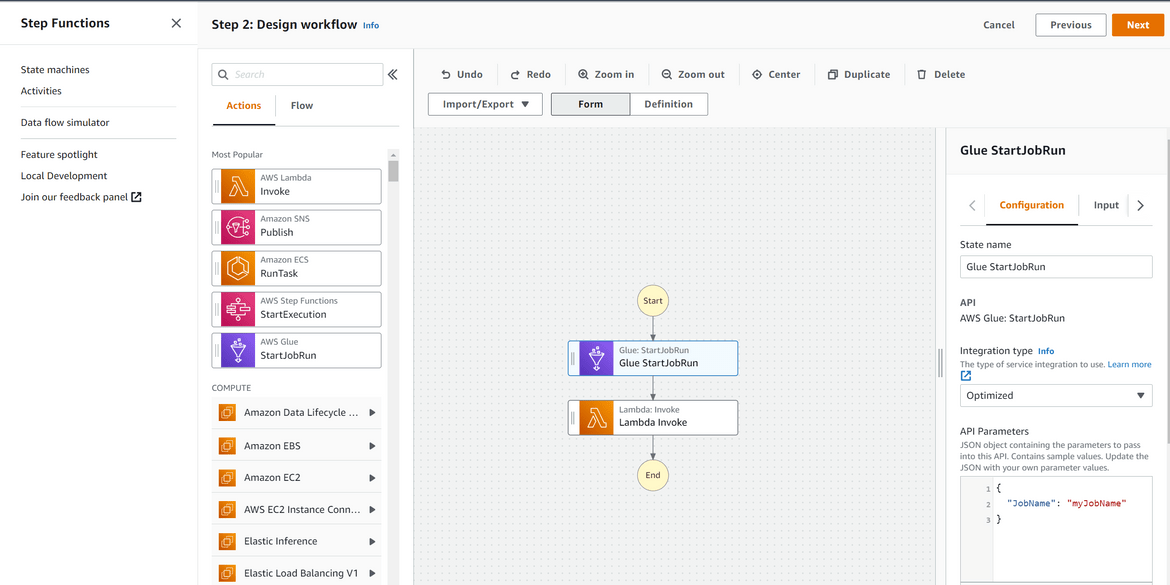
Click next, select the role and save the state machine. This will save the state machine. It can be tested by starting the execution.
To schedule the state machine run on a periodic basis, an eventbridge rule need to be created. I havent added this in the Terraform script but can be created manually from the console. Follow these steps to create the rule:
- Login to console and navigate to the Eventbridge page
- Create a new Eventbridge rule with a schedule for every 24 hours
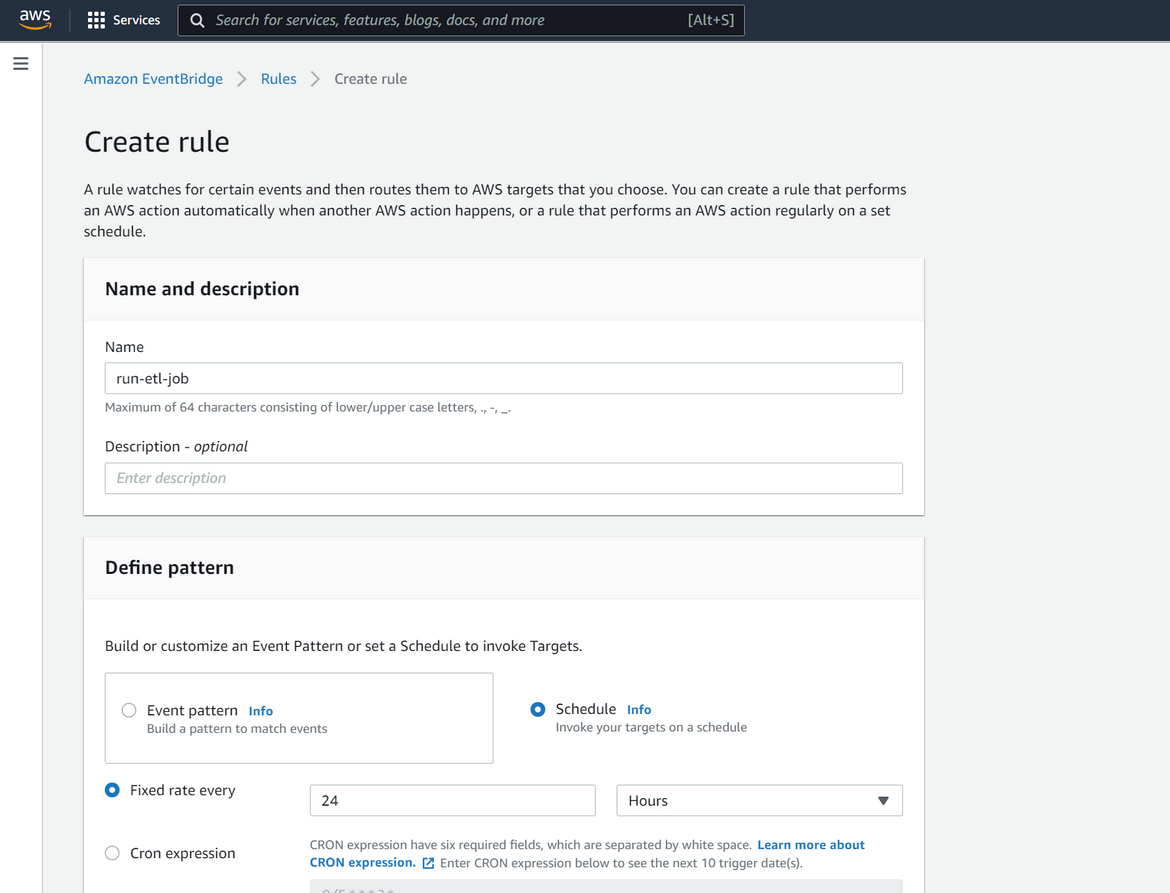
- Select the state machine as the target. Also select a new role to be created accordingly
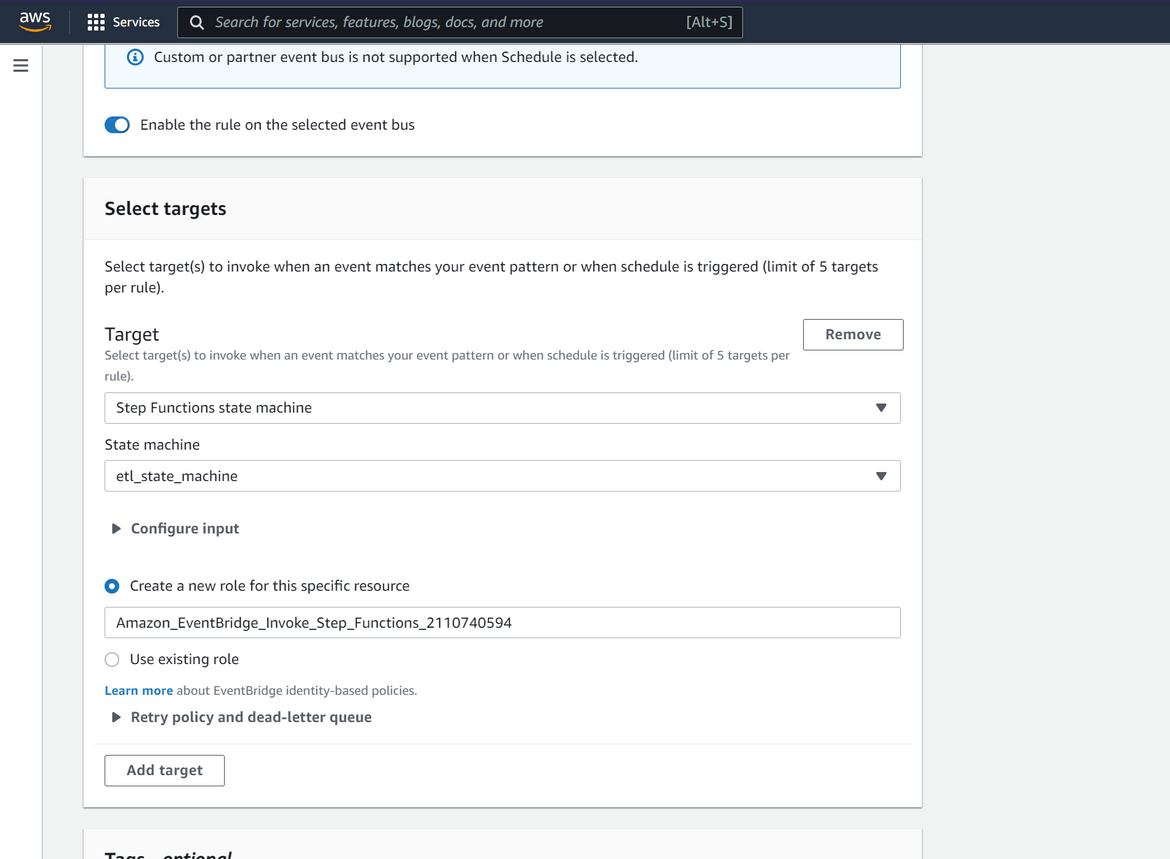
That will schedule the step function to run every 24 hours.
Visualization Dashbaord and Infrastructure
For the Visualization dashboard, an EC2 instance is deployed and Redash app is hosted on the same. The dashboard infrastructure is deployed as a Terraform module. I have not included this pipeline and kept the dashboard components in a separate folder in the infra repo (dashboard_infra). Below image shows what is deployed and handled in the Terraform script for the Dashboard deployment.
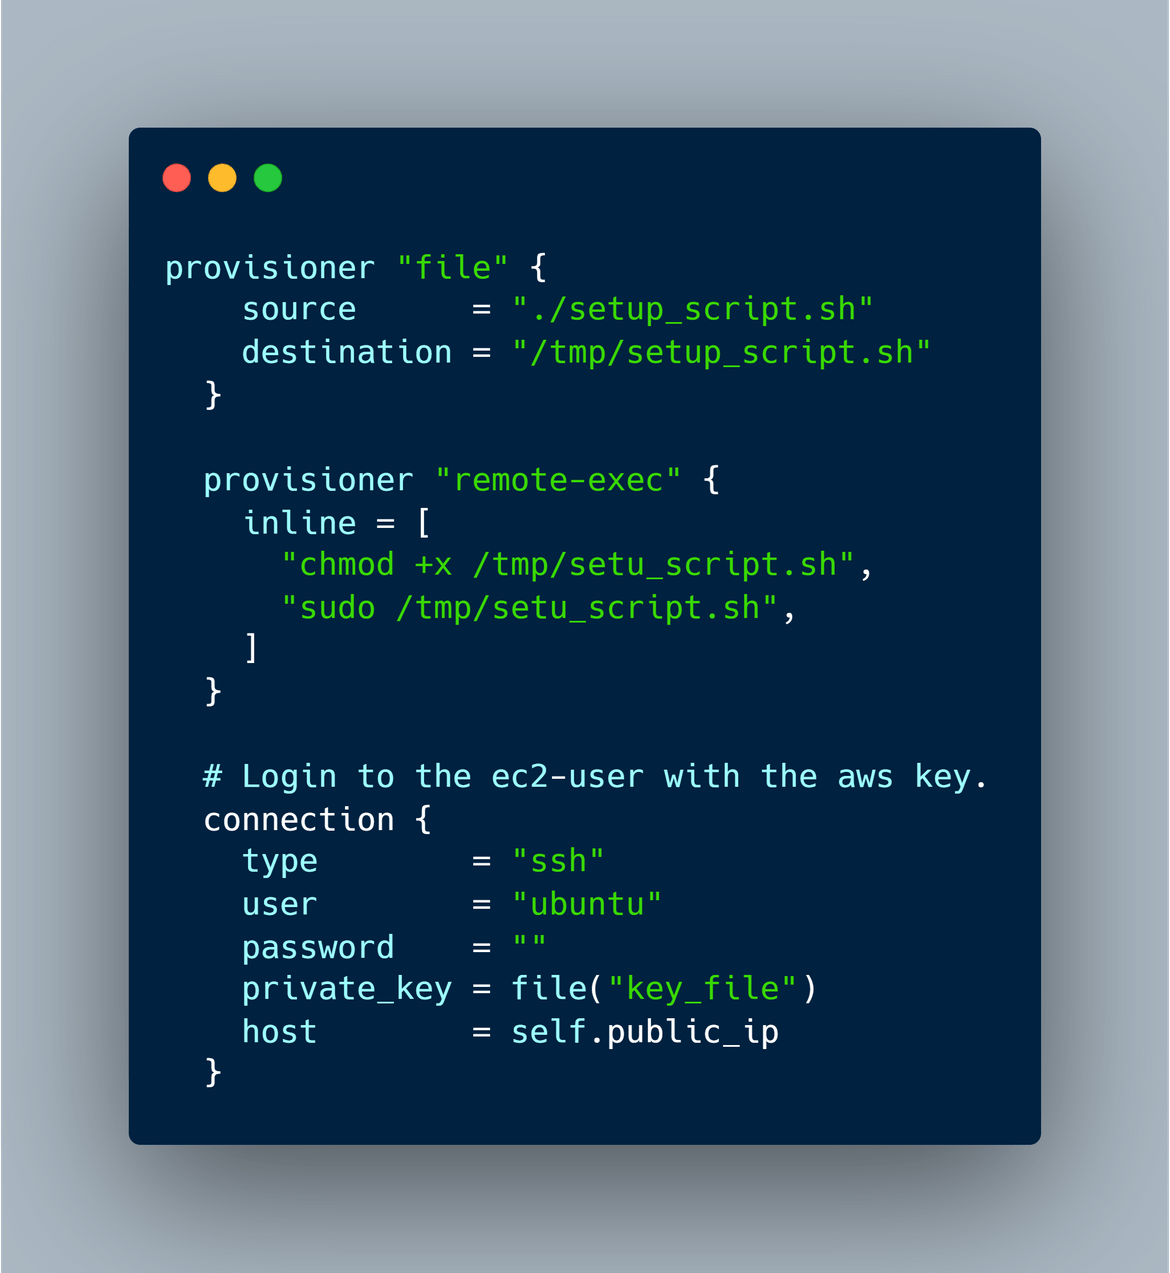
All of the infrastructure components are defined in the Terraform script. To install the Readash app on the EC2 instance, remote_exec provisioner has been used to run the setup script on EC2 and launch the Redash Docker container.
Once the instance is deployed and the setup script completes, the dashboard can be accessed by the ELB endpoint.
Deployment Pipelines
There are two deployment pipelines involved in the whole deployment. Both of the pipelines are built using Jenkins which is hosted on an EC2 instance:
- Deploy infrastructure
- Deploy application code components
There are two separate repos which separate Jenkinsfile which defines the pipelines. Let me go through each. For each of the pipeline, a Jenkinsfile is defined in each repo where all steps are defined.
Deploy Infrastructure
Below image will show the whole flow for this pipeline.
Let me go through the steps covered in this:
- As first step, the pipeline creates the S3 bucket needed for Terraform state management. This is created only during the first pipeline run.
-
Next three parallel steps run deploying different components of the infratsructure
- First deploy the infrastructure for the ETL code. It first runs Terraform validate to validate the changes and then deploys the Terraform scripts from the specific folder
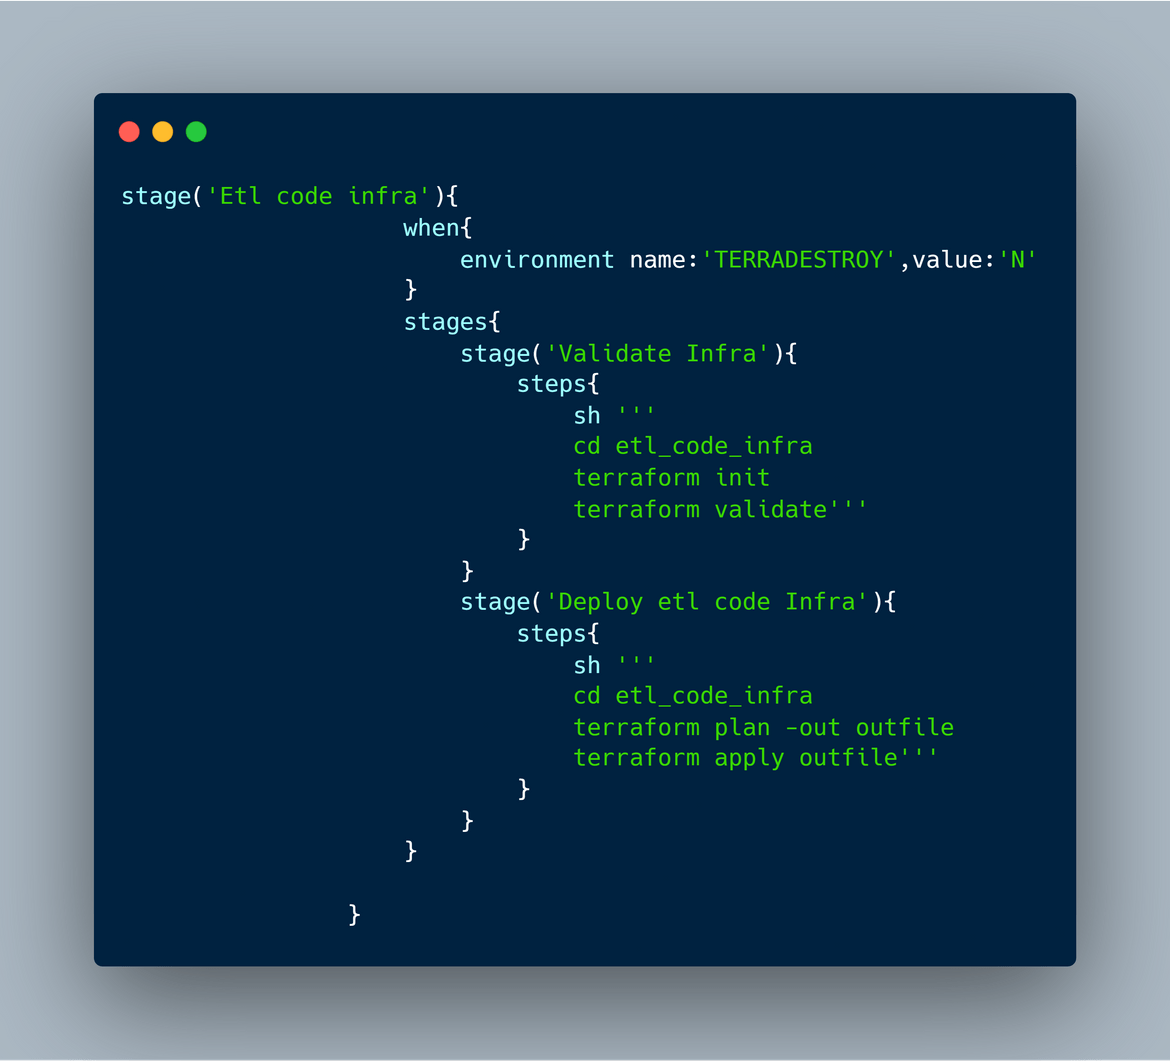
- Deploy the infrastructure needed for tge Glue job and the Glue job itself. Follow the same steps as above
- Deploy infrastructure for State machine and deploy the state machine
- First deploy the infrastructure for the ETL code. It first runs Terraform validate to validate the changes and then deploys the Terraform scripts from the specific folder
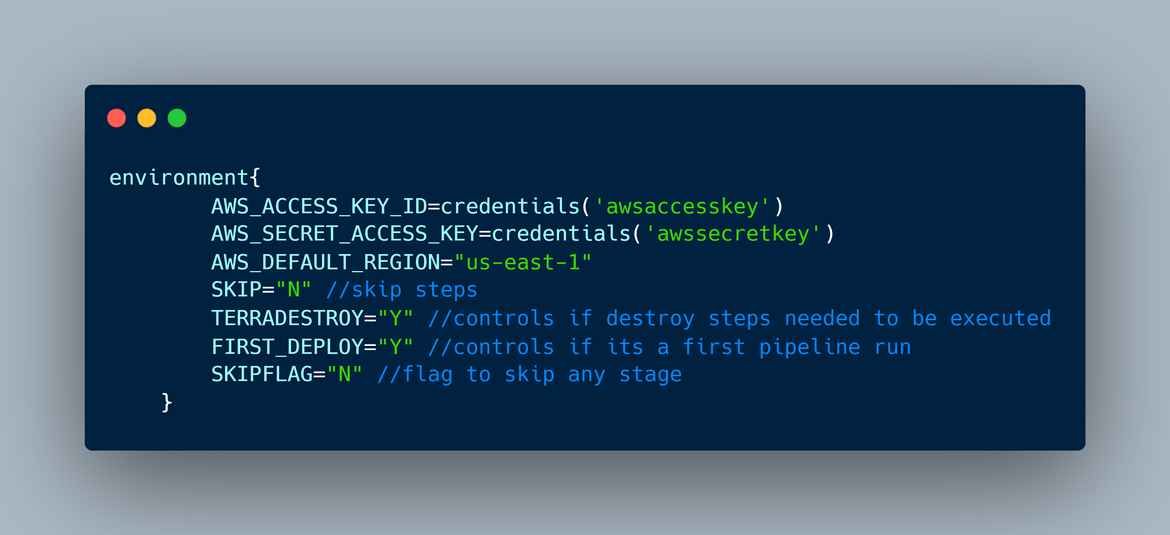
In the Jenkinsfile some of the required parameters are specified as environment variables. These parameters are needed for the deployment.
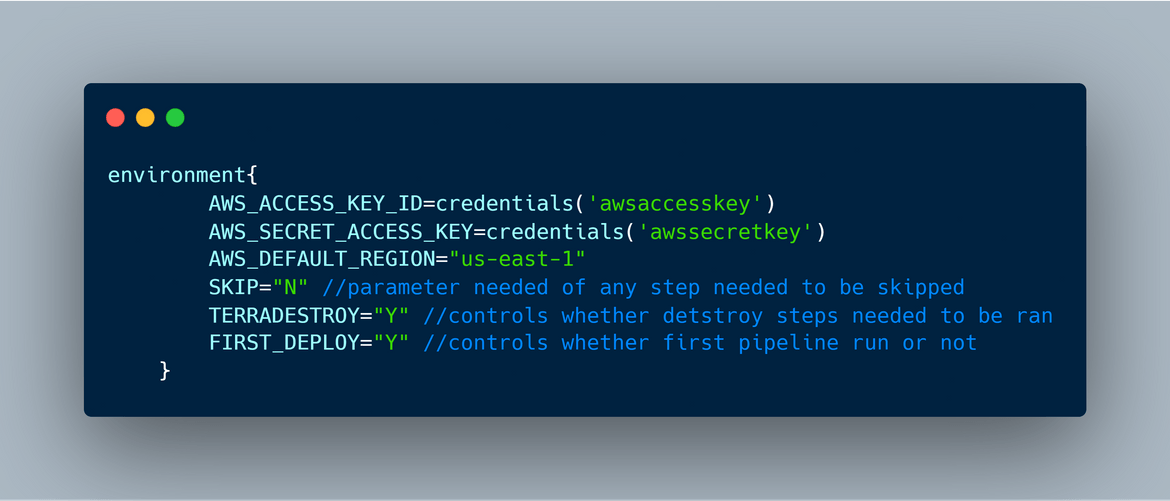
Deploy Application Code components
To deploy the application code components, below is the pipeline flow

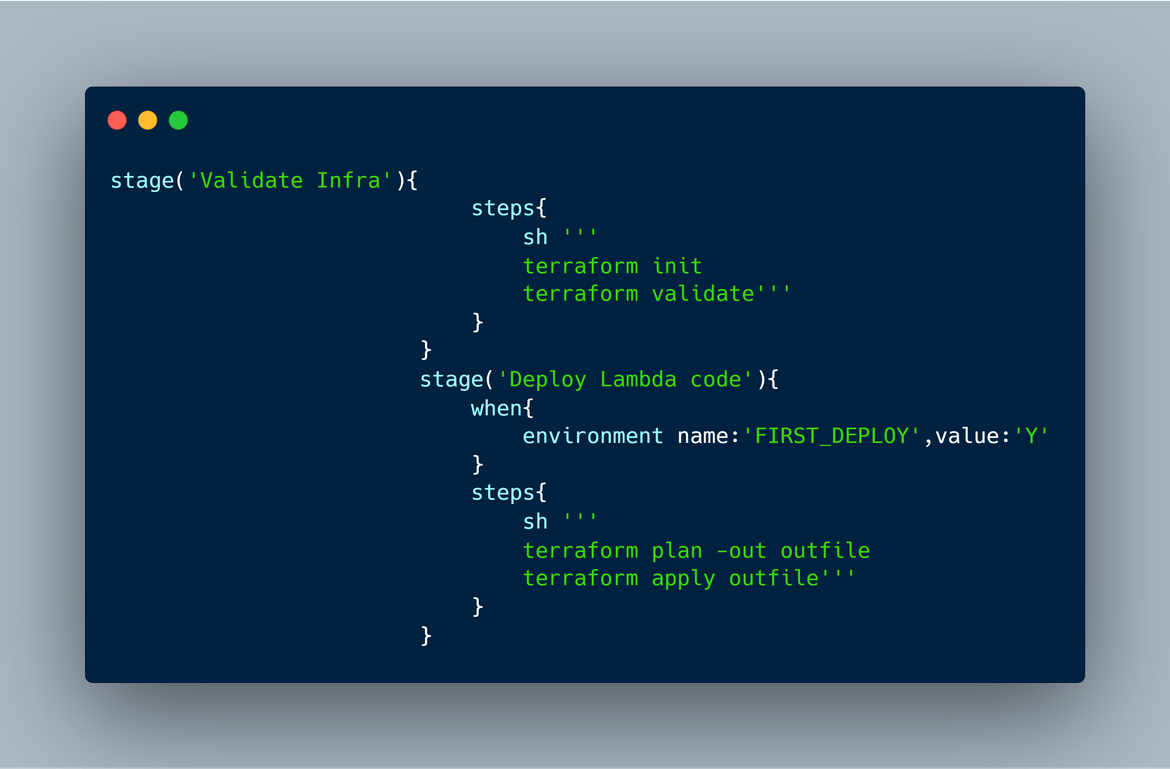
All of the Lambdas are deployed as Terraform modules. First the Terraform validate is ran to validate the script. Then Terraform apply is ran to apply or deploy the changes
The parameters for the pipeline are passed as environment variables in the Jenkinsfile. These parameters are needed for the pipeline:
This is a sample view of the actual pipeline after execution

That completes the whole deployment. The process should be up and running now.
Testing
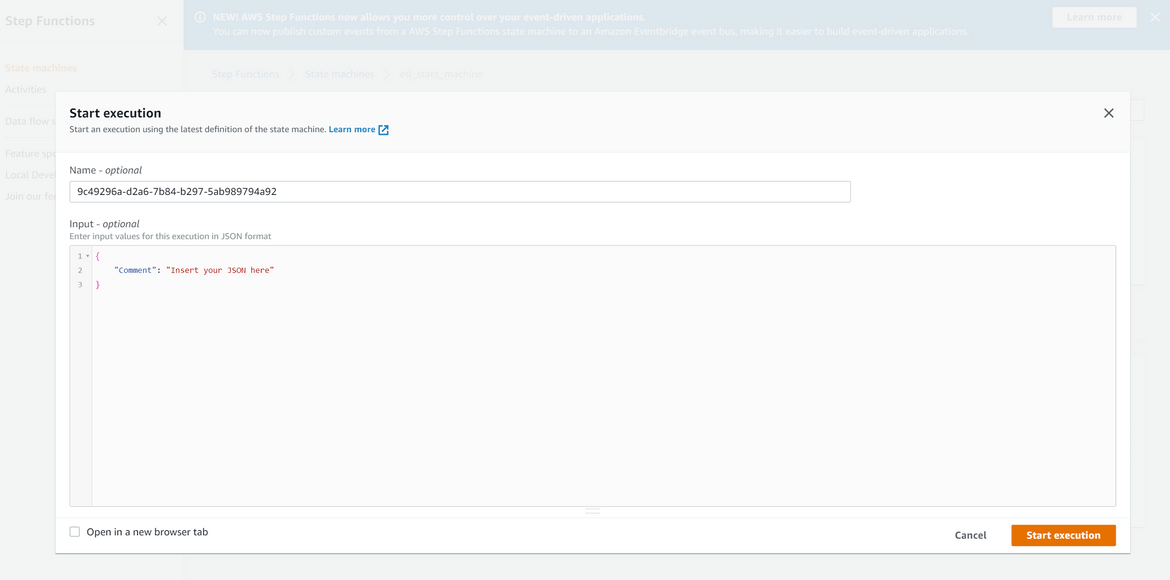
Now that deployment is complete, lets do a small test to verify the process. First lets run the ETL process manually to load the data. Navigate to the step function screen on AWS and start an execution for the state machine
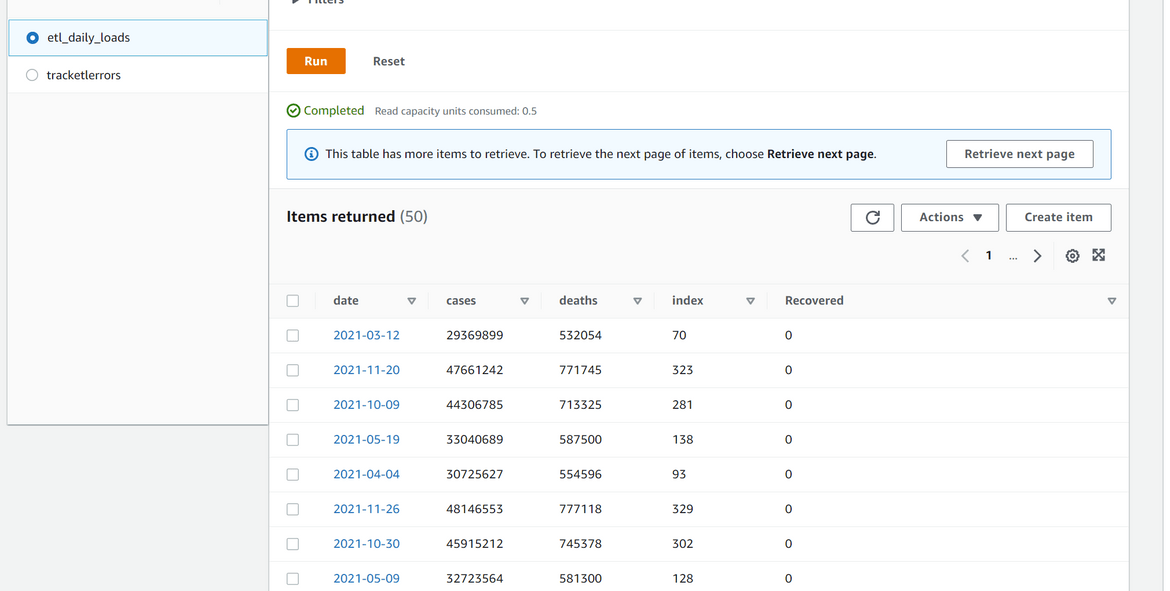
Wait for the process to finish. Once the process finishes, the state machine should show the status as success. Verify that the data is loaded properly in the DynamoDB table
An email notification is also sent depicting the status of the process.

Once the process completes, we can now verify the data on the dashboard. Login to the Redash app from the app deployment endpoint
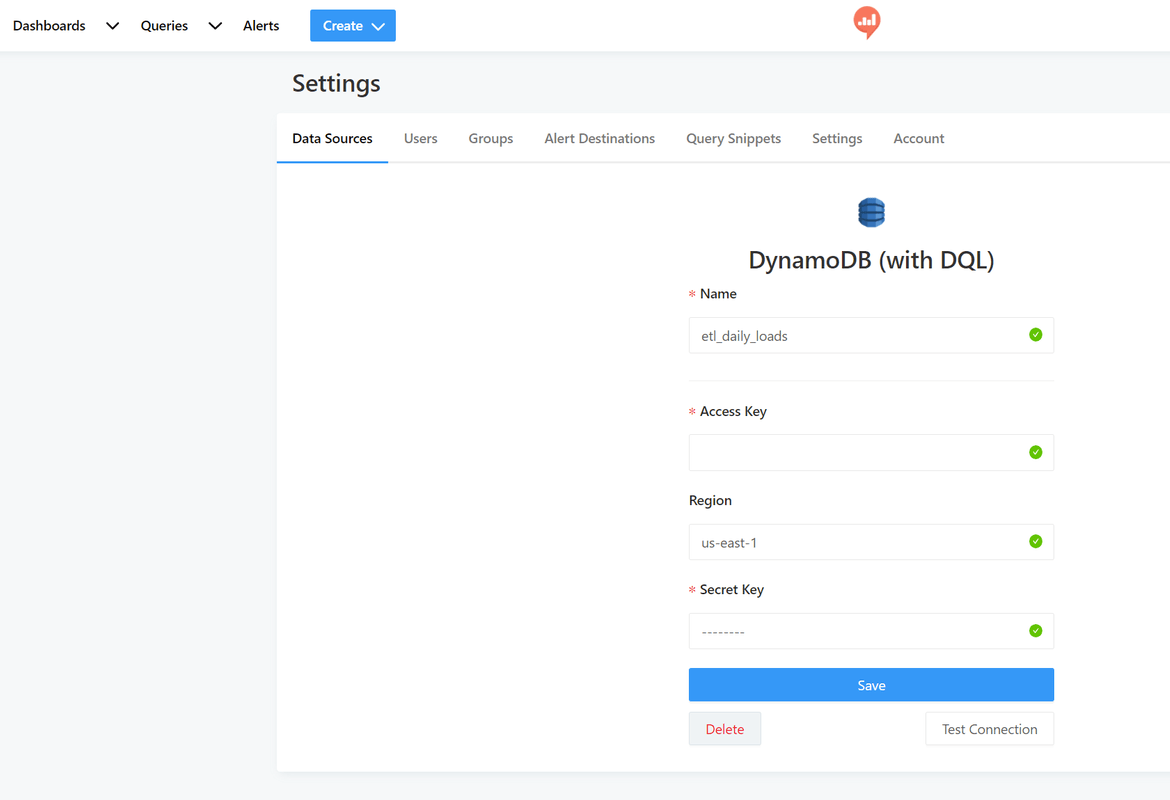
After logging in, the data source can be defined as the DynamoDB table:
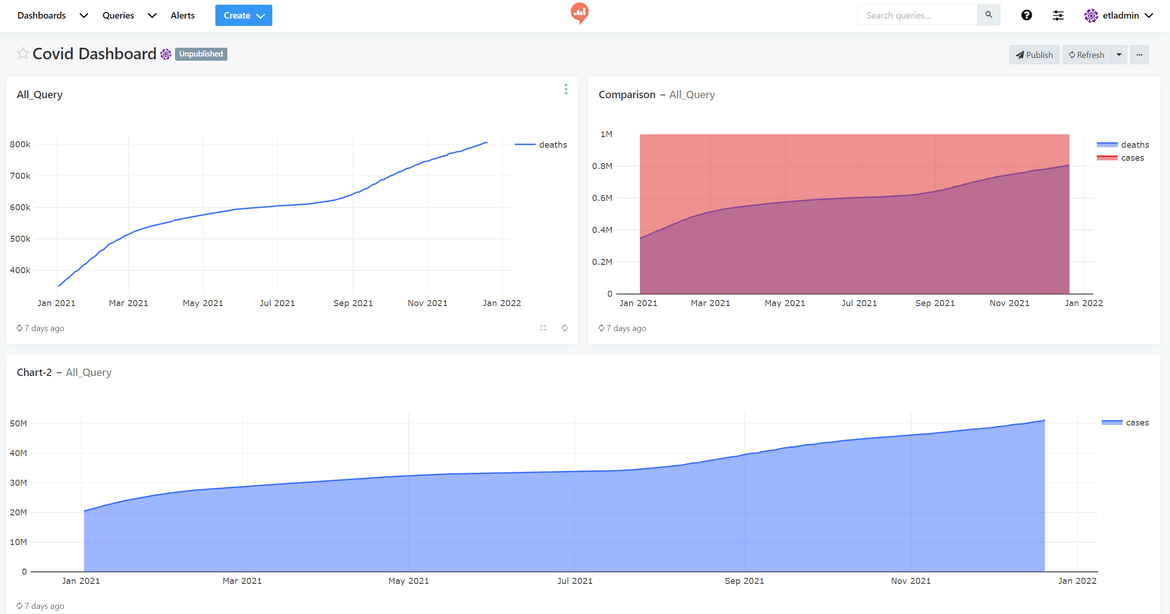
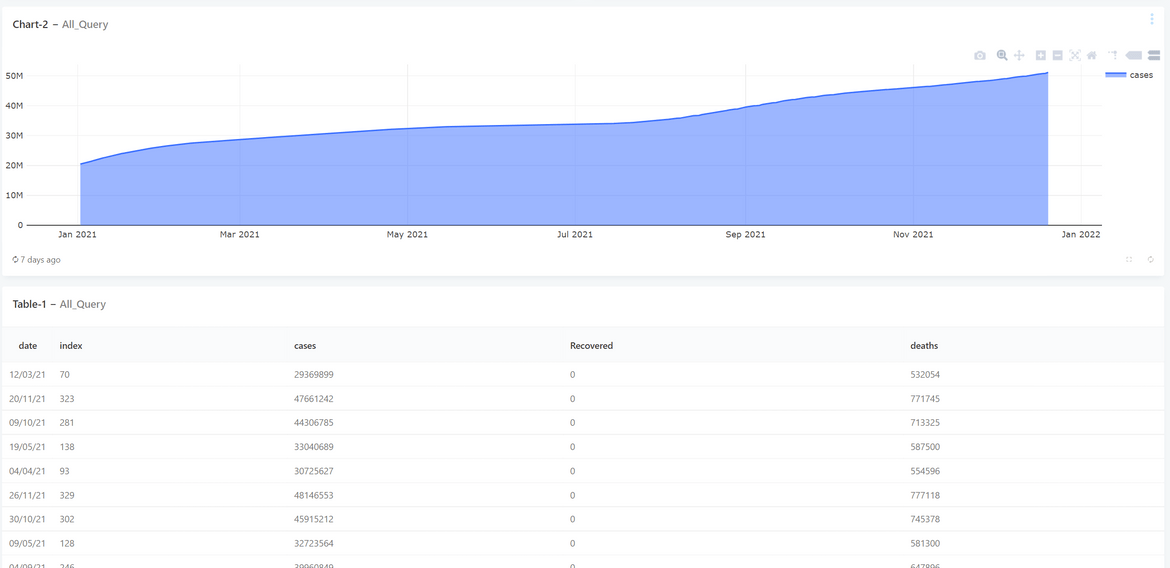
Next the visualizations can be developed based on queries on this data source
Conclusion
That concludes my approach to the Acloudguru challenge for the ETL process. Hope I was able to explain my approach and help someone with learning about these services involved. Feel free to use my Github repo if you want help with your challenge. Please reach out to me from the Contact page if any issues or questions.
