Deploy an ELK stack as Docker services to a Docker Swarm on AWS- Part 2
Deploy an ELK stack as Docker services to a Docker Swarm on AWS- Part 2
This is the 2nd part of 2-part series post, where I am walking through a way to deploy the Elasticsearch, Logstash, Kibana (ELK) Stack. In this part of the post, I will be walking through the steps to deploy Logstash as a Docker service and launching Filebeat containers to monitor the logs. I am using custom Docker images for LogStash and Filebeat to customize settings through custom config files for both.I have also included both Dockerfiles and the custom config files in the repo. If any other custom settings are needed, define the parameters in the config file and rebuild the images from the Dockerfiles.
Below are the Pre-requisites which will be needed to be installed on the servers or instances where Logstash or Filebeat will be running:
- Docker
- Docker Compose
The code files can be found in the below Github repo:
https://github.com/amlana21/elkstack-publish
Log Analysis Components
Below are the components which we will be launching or configuring through the below steps.
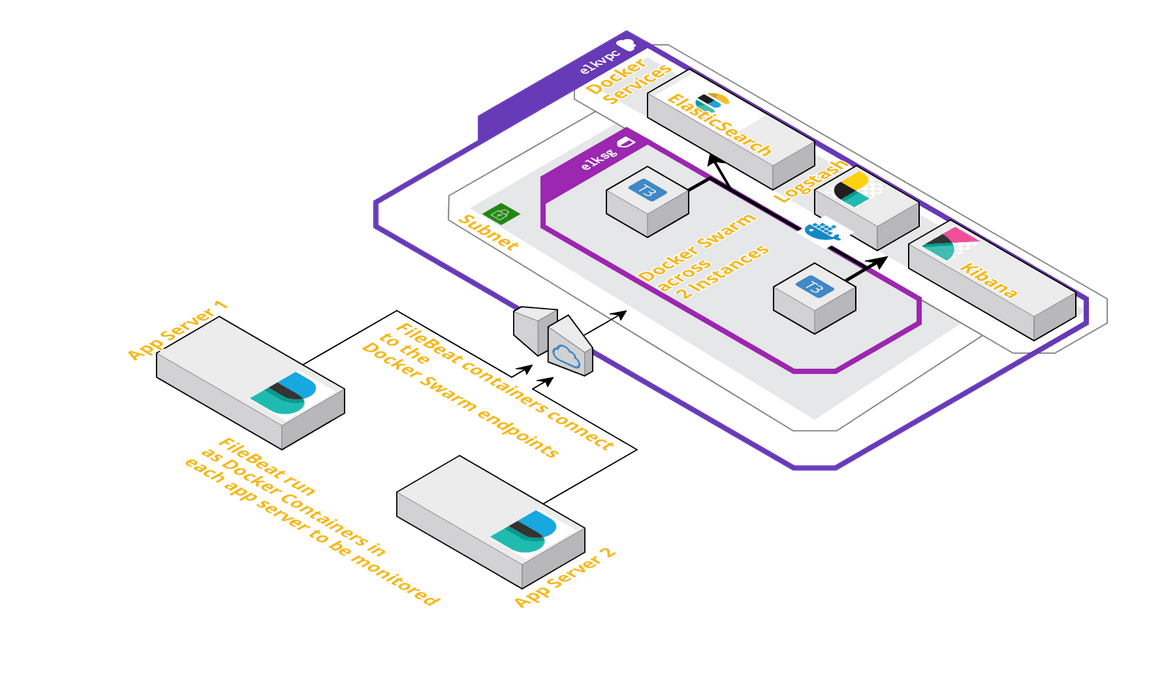
- Logstash: This is an open source data processing pipeline which will process log data from multiple sources. For our scenario Logstash will process log data sent by File beat
- Filebeat: This will be acting as a shipper which will forward log data to Logstash endpoint. This will be launched as Docker container in each of the app server where the logs have to be monitored and the log data has to be sent o the Logstash service to be analyzed by the kibana service.
Architecture
I have explained the overall architecture of this setup in part 1 of the series.Below is the architecture for reference.

In this part, I will be explaining about launching of the Logstash Docker service to the swarm and how to setup the Filebeat container in each of the app servers.The infrastructure required can be launched using the Cloudformation template which I have included in the Github repo.That template can be used to launch a Cloudformation stack which will provision the necessary networking resources and the Instances.Once the instances are launched, latest Docker need to be installed on the instances and the Docker service need to be started.
Prepare Individual Components
Logstash
Below is the Docker-compose snippet which will launch the Logstash service:
version: '3.1'

services:
 logstash:
   image: awsacdev/custom-logstash:1.0
   depends_on:
     - elasticsearch
   ports:
     - 5044:5044
   volumes:
     - /home/ubuntu/testdata:/usr/share/logstash/logdata
   user: root:root
   networks:
     - esnet
networks:
 esnet:
This uses a custom Logstash image to customize the Logstash options using a customized config file and a custom pipeline file.The image can be found on Docker hub: https://hub.docker.com/u/awsacdev. This custom image is configured to monitor incoming log data from Filebeat and also uses the File input plugin to monitor some local log folder. I have also included the Dockerfile in the Github repo. As a pre-requisite, create a local folder as the local monitored log folder, and specify the local folder in the Volume mount statement on the above Docker compose snippet above.
mkdir /home/ubuntu/testdata This cannot be tested separately as it is dependent on the Elasticsearch service. We will test this below once launched along with the other services.
Filebeat
Filebeat will be launched as a Docker container in each of the app server separately. I am using a custom Filebeat Docker image to configure the output Logstash endpoint and the local log folder paths.The cusom image can be found at: https://hub.docker.com/repository/docker/awsacdev/custom-filebeat. I have also included the filebeat.yml file in the Github repo. I will be explaining the steps to launch the Filebeat container below when launching the whole stack.
Deploy the Full stack to Docker swarm
Now that we have an understanding of all the separate components as Docker services, we will be launching the full stack with all the three services (Elasticsearch, Logstash and Kibana). Once that is launched I will be explaining how to launch and configure the Filebeat container to ship logs to the Logstash service.
Initialize the swarm
First step is to initiate the Docker swarm.Run the following command on the instance which is supposed to be the manager node:
docker swarm init --advertise-addr $(hostname -i)From the output of the above command, copy the swarm join command and run the command on the worker node after SSH’ing to the worker node.
docker swarm join <rest of copied command>Deploy the Stack
Before deploying the stack, for the Logstash service we will need a local folder path to be bind mounted to the Docker service. Please follow the steps above in the Logstash section to prepare the folder.
Below is the compose file code to deploy the stack. Copy the below code snippet and create a file called docker-stack.yml.
version: '3.1'

services:
  elasticsearch:
    image: awsacdev/custom-elasticsearch:1.0
    environment:
      - discovery.type=single-node
      - bootstrap.memory_lock=true
      - "ES_JAVA_OPTS=-Xms512m -Xmx512m"
      - "ELASTIC_PASSWORD=myesPassword"
    volumes:
      - esdata:/usr/share/elasticsearch/data
    ports:
      - 9200:9200
      - 9300:9300
    networks:
      - esnet

  kibana:
    image: awsacdev/custom-kibana:1.0
    depends_on:
      - elasticsearch
    environment:
      - SERVER_NAME=kibana.local
      - ELASTICSEARCH_URL=http://elasticsearch:9200
    ports:
      - 5601:5601
    networks:
      - esnet

  logstash:
    image: awsacdev/custom-logstash:1.0
    depends_on:
      - elasticsearch
    ports:
      - 5044:5044
    volumes:
      - /home/ubuntu/testdata:/usr/share/logstash/logdata
    user: root:root
    networks:
      - esnet


volumes:
  esdata:
    driver: local

networks:
  esnet:
This will launch the docker services to the swarm.Run the below command to launch the stack.
docker stack deploy -c docker-stack.yml elkappThis will take some time to launch all the services. Wait for some time and then run the below command to check if all the service replicas are launched:
docker stack services elkappTo test if the services are fully operational, open the kibana url: http://<instancedomainor_ip>:5601. Login with: Username:elastic, Password: myesPassword.If the Kibana app opens the services are up and we can move on to the next step to launch the Filebeat container and start shipping the logs.To test fully, the steps from Part-1 of the post can be followed.
Launch Filebeat container and Test the full stack
Filebeat container has to be launched on each of the servers where we want logs monitored.There is a custom image which I have used for the steps below. The image can be found at the Docker hub location which I specified above.Below are the steps to be followed to prepare the config parameters and launch the container.
-
I have included the filebeat config file(filebeat.yml) in the Github repo.Copy that file to a folder on the app server.Below are the contents of the file.I have specified the locations where the specific values need to be replaced.
filebeat.config: modules: path: ${path.config}/modules.d/*.yml reload.enabled: false filebeat.autodiscover: providers: - type: docker hints.enabled: true processors: - add_cloud_metadata: ~ - add_docker_metadata: ~ output.logstash: hosts: ["<instance_ip_domain_of_logstash>:5044"] filebeat.inputs: - type: log paths: - /usr/share/filebeat/logdata/access_log - /usr/share/filebeat/logdata/access.log - /usr/share/filebeat/logdata/<any_other_log_file_name_to_monitor> -
Navigate to the folder where the custom filebeat.yml file is placed.Run the below command to launch the Filebeat container:
docker container run -itd --name beat2 --user root:root -v <1st volume>:/usr/share/filebeat/logdata -v <2nd volume>:/usr/share/filebeat/filebeat.yml awsacdev/custom-filebeat:1.0Make sure to replace below two values with actual folder paths:
- 1st volume: The absolute path of the log files to be monitored
-
2nd volume: The absolute local path of the filbeat.yml file (e.g: /root/beatcont/filebeat.yml)
Once the container is launched, check the container logs for any errors. If no errors, the Filebeat is up and running on the app server and shipping log data to Logstash.docker container logs beat2
Test the services
Now we are ready to test how the whole stack which we deployed works and displays the log data sent from the Filebeat containers.First create a test log file with any of the names which were specified to be monitored in the filebeat.yml file above(e.g access_log, access.log).The log file has to be created at the location which was specified as 1st volume while launching the filebeat container.
cd /path_to_logs
touch access_log
vi access_log
Enter the below sample log data in the sample log file:
10.0.0.0 - test_log [29/Dec/2019:11:00:00 -0600] "GET /admin HTTP/1.1" 301 566 "-" "Mozilla/5.0 (Windows; U; Windows NT 5.1; en-US; rv:1.9.2.3) Gecko/20100401 Firefox/3.6.3"
20.12.12.23 - - [29/Dec/2019:11:00:00 -0600] "GET /favicon.ico HTTP/1.1" 200 1189 "-" "Mozilla/4.0 (compatible; MSIE 8.0; Windows NT 5.1; Trident/4.0; .NET CLR 2.0.50727; .NET CLR 3.0.4506.2152; .NET CLR 3.5.30729; InfoPath.2; .NET4.0C; .NET4.0E)"
11.11.11.11 - - [29/Dec/2019:11:00:00 -0600] "GET /js/index.js HTTP/1.1" 200 1837 "http://www.mywebsite.com/index.html" "Mozilla/5.0 (Windows NT 6.0; WOW64; rv:2.0.1) Gecko/20100101 Firefox/4.0.1"
Once the log file is saved, we will test if the log data is visible on Kibana App.Follow the below steps to test the logs in Kibana:
- Log in to Kibana: : http://<instancedomainor_ip>:5601
- Use credentials: elastic myesPassword
- Once logged in, navigate to the Discover tab
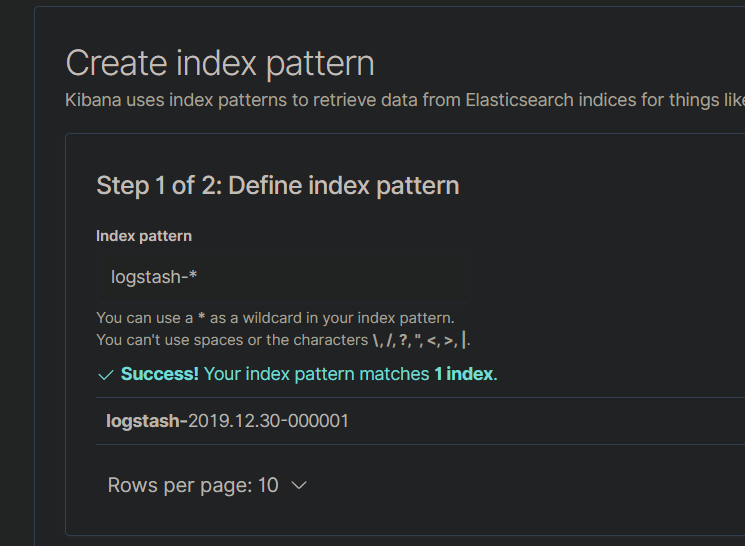
- Create a new Index and provide the index pattern as seen on the Kibana page

- Save the Index and navigate back to the Discover tab
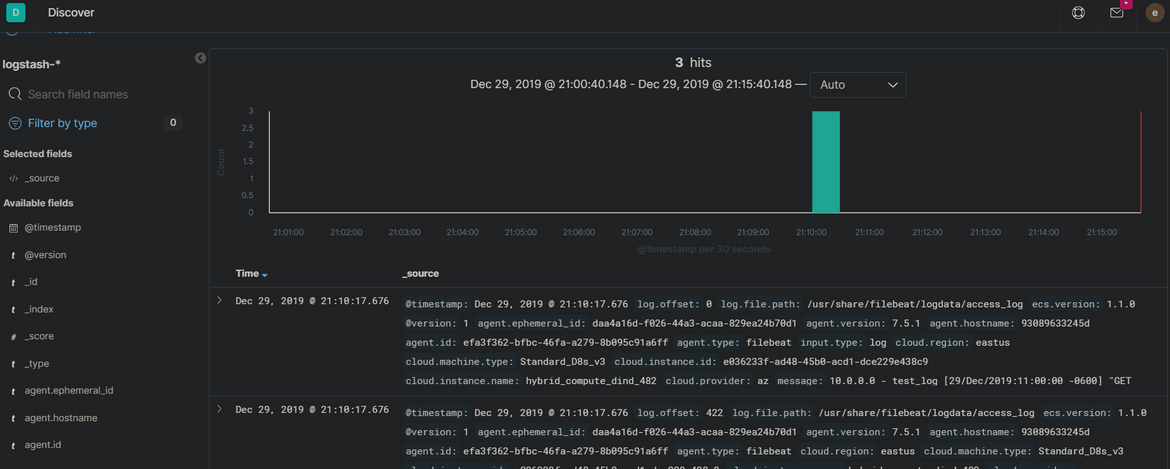
- You should be able to see the log data which was entered in the sample log file above

- This confirms that Filbeat is able to send the log data to Logstash which then sends it to Elasticsearch and is displayed on Kibana
Troubleshooting
If any of the components doesnt seem to work properly or the log data is not visible as expected on Kibana, errors or issues can be checked by checking the logs for each launched Docker container or service. Use the below commands to chec the errors in each of the components:
-
Check Filebeat logs:
docker container logs <filbeat_container_name> -
Check Logstash logs:
docker service logs <logstash_service_name> -
Check Elasticsearch logs:
docker service logs <elasticsearch_service_name> -
Check Kibana Logs:
docker service logs <kibana_service_name>
Conclusion
In this 2-Part series post I went through steps to deploy ELK stack on Docker Swarm and configure the services to receive log data from Filebeat.To use this setup in Production there are some other settings which need to configured but overall the method stays the same.ELK stack is really useful to monitor and analyze logs, to understand how an app is performing. I use ELK stack to monitor many of my application logs in a centralized manner.If any questions then go ahead and create an issue on the Github repo or email me at amlanc@achakladar.com.